
 Score
Dashboard
Weak Long Term Fundamental Strength with an average Return on Capital Employed (ROCE) of 6.44%
- Poor long term growth as Net Sales has grown by an annual rate of 11.17% and Operating profit at 4.40% over the last 5 years
- Low ability to service debt as the company has a high Debt to EBITDA ratio of 2.73 times
Flat results in Sep 26


 Total Returns
 (Price + Dividend) 
Vinayak Polycon for the last several years.
Risk Adjusted Returns v/s
Returns Beta
 News & Corporate Actions
News
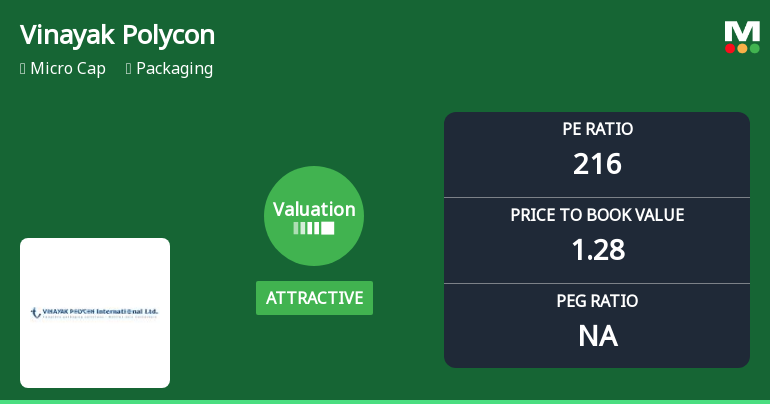
Vinayak Polycon International Ltd Valuation Shifts Signal Renewed Price Attractiveness
Vinayak Polycon International Ltd, a micro-cap player in the packaging sector, has seen a notable shift in its valuation parameters, moving from a risky to an attractive valuation grade. Despite a challenging year-to-date return of -18.4%, the company’s price-to-earnings (P/E) and price-to-book value (P/BV) ratios suggest a potential reappraisal by investors when compared to its peers and historical benchmarks.
Read More Announcements
Announcement under Regulation 30 (LODR)-Newspaper Publication
01-Nov-2026 | Source : BSENewspaper advertisement of extract of un-audited financial result for the quarter and half year ended september 30 2026
Un-Audited Financial Results For The Second Quarter And Half Year Ended On 30Th September 2026
31-Oct-2026 | Source : BSEUn-Audited Financial results for the Second Quarter and Half year ended on 30th September 2026
Board Meeting Outcome for Board Meeting Outcome For For Disclosures Under Regulation 30 And Regulation 33 Of The SEBI (Listing Obligations And Disclosure Requirements) Regulations 2015 (Listing Regulations)- Outcome Of Board Meeting Held On October 31 20
31-Oct-2026 | Source : BSEBoard Meeting Outcome for For Disclosures Under Regulation 30 And Regulation 33 Of The SEBI (Listing Obligations And Disclosure Requirements) Regulations 2015 (Listing Regulations)- Outcome Of Board Meeting Held On October 31 2026
Corporate Actions

No Upcoming Board Meetings

No Dividend history available

No Splits history available

No Bonus history available

No Rights history available
Key FactorsQuality key factors
Valuation key factors
Technicals key factors
 Technical Indicator Scale: Bearish, Mildly Bearish, Sideways, Mildly Bullish, Bullish Turned Shareholding
Shareholding Snapshot : Sep 2026
Shareholding Compare (%holding)
Promoters
None
Held by 0 Schemes
Held by 0 FIIs
Jai Sinter Polycon Private Limited (11.52%)
Sankalp Granites Private Limited (10.49%)
14.52%
FinancialQuarterly Results Snapshot (Standalone) - Sep'26 - QoQ
 Compare with Peers

QoQ Growth in quarter ended Sep 2026 is 1.48% vs 20.12% in Jun 2026
QoQ Growth in quarter ended Sep 2026 is -25.00% vs 166.67% in Jun 2026

Half Yearly Results Snapshot (Standalone) - Sep'25

Growth in half year ended Sep 2025 is 1.71% vs -5.50% in Sep 2024
Growth in half year ended Sep 2025 is 25.00% vs -11.11% in Sep 2024
Nine Monthly Results Snapshot (Standalone) - Dec'25
YoY Growth in nine months ended Dec 2025 is -7.66% vs 0.50% in Dec 2024
YoY Growth in nine months ended Dec 2025 is -21.43% vs -12.50% in Dec 2024
Annual Results Snapshot (Standalone) - Mar'26
YoY Growth in year ended Mar 2026 is -6.00% vs -1.58% in Mar 2025
YoY Growth in year ended Mar 2026 is -77.27% vs -24.14% in Mar 2025
 Company CV
About Vinayak Polycon International Ltd

Company Coordinates


