
 Score
Dashboard
Weak Long Term Fundamental Strength with an average Return on Equity (ROE) of 8.52%
- Poor long term growth as Net Sales has grown by an annual rate of 11.73% and Operating profit at 11.42%
With a growth in Net Sales of 718.18%, the company declared Very Positive results in Sep 26
Stock is technically in a Mildly Bullish range
With ROE of 7.6, it has a Attractive valuation with a 0.3 Price to Book Value
Despite the size of the company, domestic mutual funds hold only 0.23% of the company
Mojo ParametersStock DNA

Non Banking Financial Company (NBFC)

INR 1,137 Cr (Micro Cap)

4.00
20

0.14%

0.00

7.63%

0.27
Total ReturnsTotal Returns (Price + Dividend) 
Latest dividend: 5 per share ex-dividend date: Aug-28-2026
Risk Adjusted Returns v/s
Returns Beta
 News & Corporate Actions
News
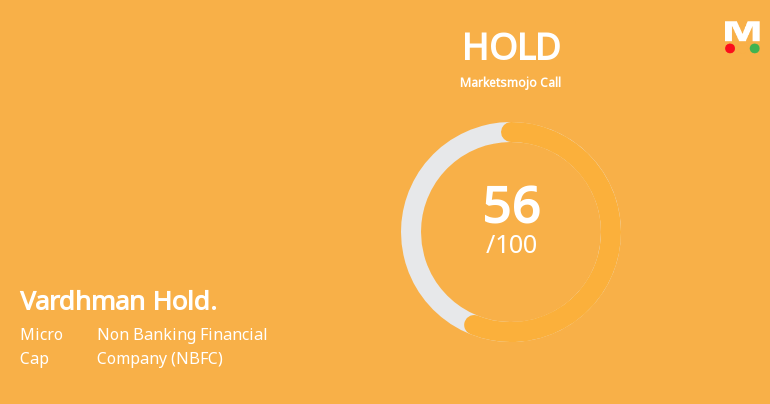
Vardhman Holdings Ltd is Rated Hold by MarketsMOJO
Vardhman Holdings Ltd is rated 'Hold' by MarketsMOJO, with this rating last updated on 02 Nov 2026. While the rating was revised on that date, the analysis and financial metrics discussed here reflect the stock's current position as of 21 November 2026, providing investors with an up-to-date perspective on the company's fundamentals, valuation, financial trends, and technical outlook.
Read More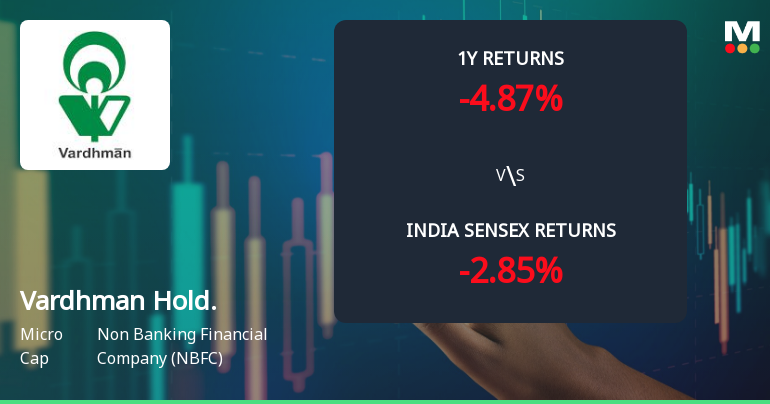
Vardhman Holdings Ltd Technical Momentum Shifts Amid Mixed Market Signals
Vardhman Holdings Ltd, a micro-cap player in the Non Banking Financial Company (NBFC) sector, has recently experienced a nuanced shift in its technical momentum, moving from a bullish to a mildly bullish stance. This transition is underscored by mixed signals from key technical indicators such as MACD, RSI, moving averages, and Bollinger Bands, reflecting a complex market sentiment amid fluctuating price action.
Read More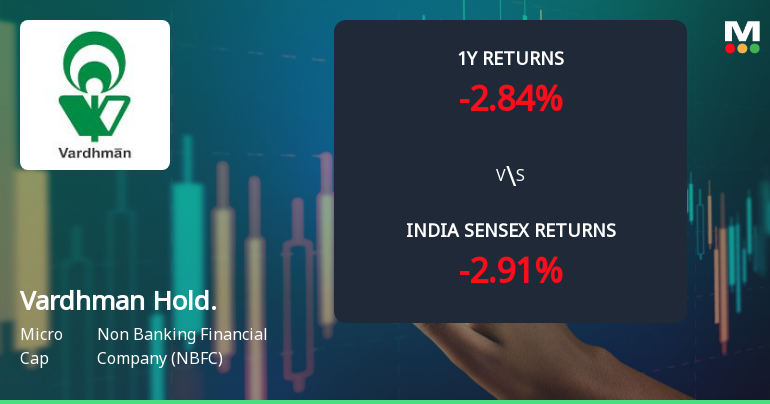
Vardhman Holdings Ltd Technical Momentum Shifts Signal Bullish Outlook
Vardhman Holdings Ltd, a micro-cap player in the Non Banking Financial Company (NBFC) sector, has witnessed a notable shift in its technical momentum, upgrading its outlook from mildly bullish to bullish. This change is underpinned by a confluence of positive signals from key technical indicators including MACD, moving averages, and Bollinger Bands, suggesting a potential uptrend despite recent price volatility.
Read More Announcements
Announcement under Regulation 30 (LODR)-Newspaper Publication
11-Nov-2026 | Source : BSEPlease find enclosed herewith a copy of Newspapers Publication.
Results- Financial Results For The Quarter/ Half Year Ended 30.09.2026
10-Nov-2026 | Source : BSEPlease find attached herewith Un-Audited Financial Results for the quarter/ half year ended 30.09.2026.
Board Meeting Outcome for Results- Financial Results For The Quarter/ Half Year Ended 30.09.2026.
10-Nov-2026 | Source : BSEPlease find attached herewith Un-Audited Financial Results for the quarter/ half year ended 30.09.2026.
Corporate Actions

No Upcoming Board Meetings

Vardhman Holdings Ltd has declared 50% dividend, ex-date: 28 Aug 26

No Splits history available

No Bonus history available

No Rights history available
Key FactorsQuality key factors
Valuation key factors
Technicals key factors
 Technical Indicator Scale: Bearish, Mildly Bearish, Sideways, Mildly Bullish, Bullish Turned Shareholding
Shareholding Snapshot : Sep 2026
Shareholding Compare (%holding)
Promoters
None
Held by 1 Schemes (0.06%)
Held by 7 FIIs (0.05%)
Devakar Investment And Trading Company Private Limited (34.29%)
Anil Kumar Goel (4.79%)
19.78%
FinancialQuarterly Results Snapshot (Consolidated) - Sep'26 - YoY
 Compare with Peers

YoY Growth in quarter ended Sep 2026 is 718.18% vs -62.84% in Sep 2025
YoY Growth in quarter ended Sep 2026 is 141.63% vs -6.60% in Sep 2025

Half Yearly Results Snapshot (Consolidated) - Sep'25
Growth in half year ended Sep 2025 is -56.00% vs -61.29% in Sep 2024

Growth in half year ended Sep 2025 is -11.27% vs 15.87% in Sep 2024
Nine Monthly Results Snapshot (Consolidated) - Dec'25
YoY Growth in nine months ended Dec 2025 is -42.05% vs -53.14% in Dec 2024
YoY Growth in nine months ended Dec 2025 is -13.74% vs 18.16% in Dec 2024
Annual Results Snapshot (Consolidated) - Mar'26
YoY Growth in year ended Mar 2026 is -46.20% vs 52.82% in Mar 2025
YoY Growth in year ended Mar 2026 is -16.28% vs 39.56% in Mar 2025
 Company CV
About Vardhman Holdings Ltd

Company Coordinates


