
 Score
Dashboard
Poor Management Efficiency with a low ROCE of 2.30%
- The company has been able to generate a Return on Capital Employed (avg) of 2.30% signifying low profitability per unit of total capital (equity and debt)
Company's ability to service its debt is weak with a poor EBIT to Interest (avg) ratio of 0.74
Stock is technically in a Mildly Bearish range
With ROE of 10.7, it has a Very Expensive valuation with a 27.3 Price to Book Value
Despite the size of the company, domestic mutual funds hold only 0% of the company


 Total Returns
 (Price + Dividend) 
Emrock Corporati for the last several years.
Risk Adjusted Returns v/s
Returns Beta
 News & Corporate Actions
News
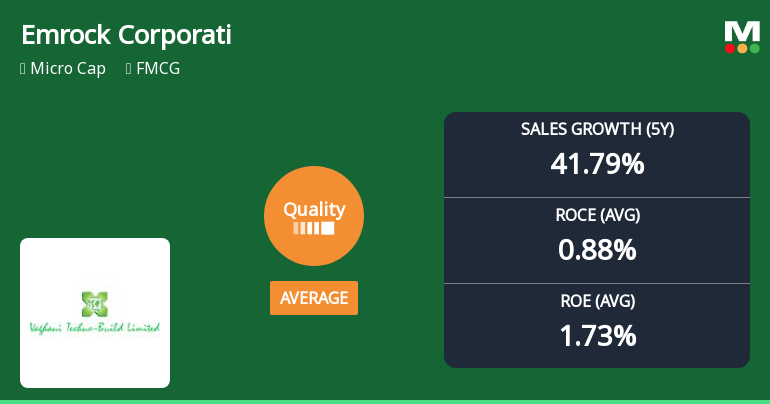
Emrock Corporation Limited Quality Grade Upgrade Signals Fundamental Improvements
Emrock Corporation Limited has seen its quality grade improve from below average to average, reflecting a nuanced shift in its business fundamentals. Despite a modest return on capital employed (ROCE) and return on equity (ROE), the company’s sales and earnings growth over five years remain robust. However, certain financial metrics and capital efficiency indicators suggest areas of concern for investors seeking consistent profitability and strong balance sheet health.
Read More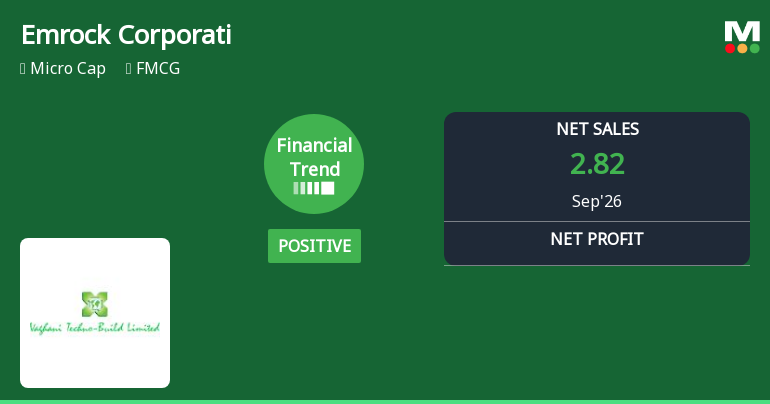
Emrock Corporation Limited Reports Strong Quarterly Financial Turnaround Amid Market Outperformance
Emrock Corporation Limited, a micro-cap player in the FMCG sector, has demonstrated a notable turnaround in its financial performance for the quarter ended September 2026. The company’s financial trend has shifted from flat to positive, supported by record quarterly earnings and improved profitability metrics, signalling a potential inflection point for investors.
Read More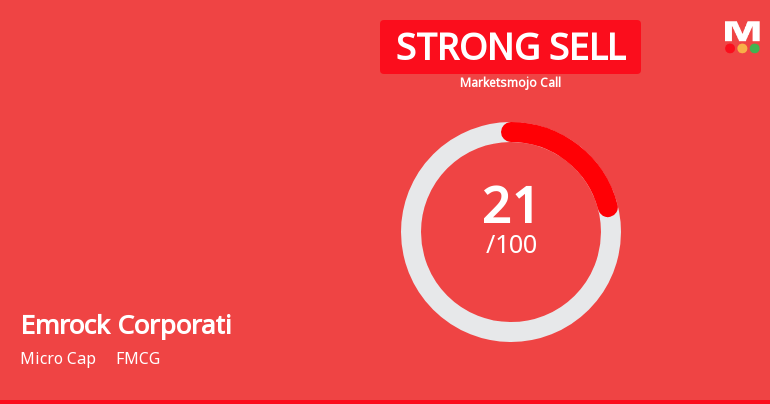
Emrock Corporation Limited is Rated Strong Sell
Emrock Corporation Limited is rated Strong Sell by MarketsMOJO, with this rating last updated on 19 October 2026. However, the analysis and financial metrics presented here reflect the stock's current position as of 11 November 2026, providing investors with the latest insights into the company’s performance and outlook.
Read More Announcements
Announcement under Regulation 30 (LODR)-Newspaper Publication
06-Nov-2026 | Source : BSEUn-Audited Financial Results Publish in Newspaper
Disclosures under Reg. 29(2) of SEBI (SAST) Regulations 2011
05-Nov-2026 | Source : BSEThe Exchange has received the disclosure under Regulation 29(2) of SEBI (Substantial Acquisition of Shares & Takeovers) Regulations 2011 for Parth Tulsibhai Patel
Disclosures under Reg. 29(1) of SEBI (SAST) Regulations 2011
05-Nov-2026 | Source : BSEThe Exchange has received the disclosure under Regulation 29(1) of SEBI (Substantial Acquisition of Shares & Takeovers) Regulations 2011 for Arjunkumar Patel
Corporate Actions

No Upcoming Board Meetings

No Dividend history available

No Splits history available

No Bonus history available

No Rights history available
Key FactorsQuality key factors
Valuation key factors
Technicals key factors
 Technical Indicator Scale: Bearish, Mildly Bearish, Sideways, Mildly Bullish, Bullish Turned Shareholding
Shareholding Snapshot : Sep 2026
Shareholding Compare (%holding)
Promoters
None
Held by 0 Schemes
Held by 0 FIIs
Arjunkumar Jagdishbhai Patel (25.37%)
Neeki Bhavinkumar Patel (3.16%)
24.73%
FinancialQuarterly Results Snapshot (Standalone) - Sep'26 - QoQ
 Compare with Peers

QoQ Growth in quarter ended Sep 2026 is 526.67% vs -52.13% in Jun 2026
QoQ Growth in quarter ended Sep 2026 is 836.84% vs -53.66% in Jun 2026

Half Yearly Results Snapshot (Standalone) - Sep'25
Growth in half year ended Sep 2025 is 0.00% vs 0.00% in Sep 2024
Growth in half year ended Sep 2025 is 3,300.00% vs 107.14% in Sep 2024
Nine Monthly Results Snapshot (Standalone) - Dec'25
YoY Growth in nine months ended Dec 2025 is 0.00% vs 0.00% in Dec 2024
YoY Growth in nine months ended Dec 2025 is 3,500.00% vs 116.67% in Dec 2024
Annual Results Snapshot (Standalone) - Mar'26
YoY Growth in year ended Mar 2026 is 312.00% vs 0.00% in Mar 2025
YoY Growth in year ended Mar 2026 is 611.76% vs 270.00% in Mar 2025
 Company CV
About Emrock Corporation Limited

Company Coordinates


