
 Score
Dashboard
Weak Long Term Fundamental Strength with an average Return on Capital Employed (ROCE) of 5.59%
- Low ability to service debt as the company has a high Debt to EBITDA ratio of 8.63 times
The company has declared Negative results for the last 3 consecutive quarters
Stock is technically in a Mildly Bearish range
Underperformed the market in the last 1 year
Mojo ParametersStock DNA

Garments & Apparels

INR 44 Cr (Micro Cap)

55.00
19

0.00%

0.78

1.39%

0.78
Total ReturnsTotal Returns (Price + Dividend) 
Latest dividend: 0.41668341708542717 per share ex-dividend date: Jul-18-2019
Risk Adjusted Returns v/s
Returns Beta
 News & Corporate Actions
News
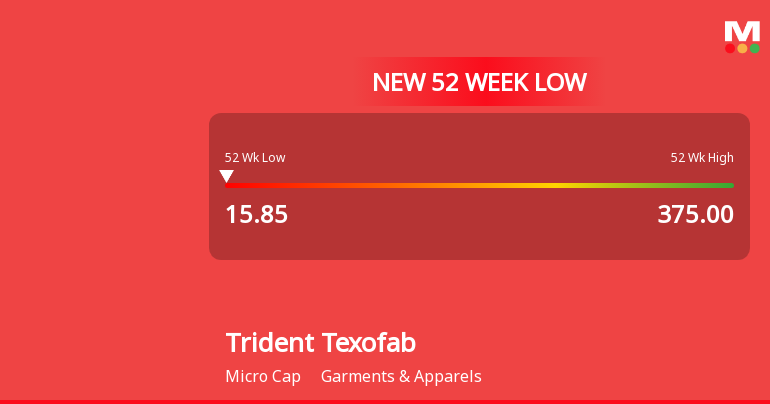
Five Consecutive Losses Push Trident Texofab Ltd to a New 52-Week Low
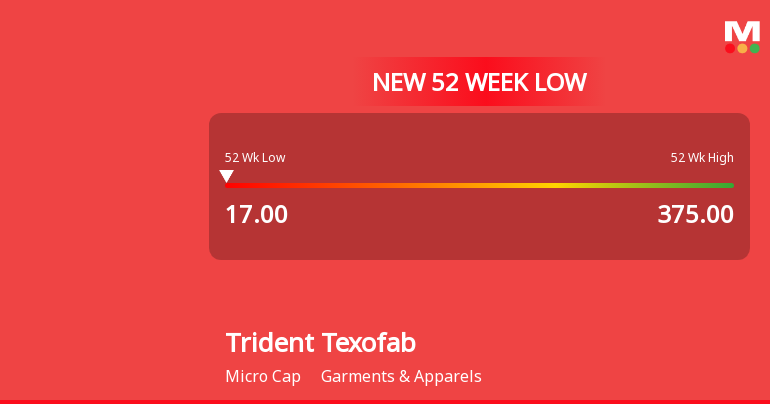
For the eighth consecutive session, Trident Texofab Ltd has closed lower, culminating in a fresh 52-week low of Rs 15.85 on 28 Oct 2026. This marks a steep decline of 17.75% over this losing streak, underscoring persistent selling pressure despite some stabilisation in broader market indices.
Read More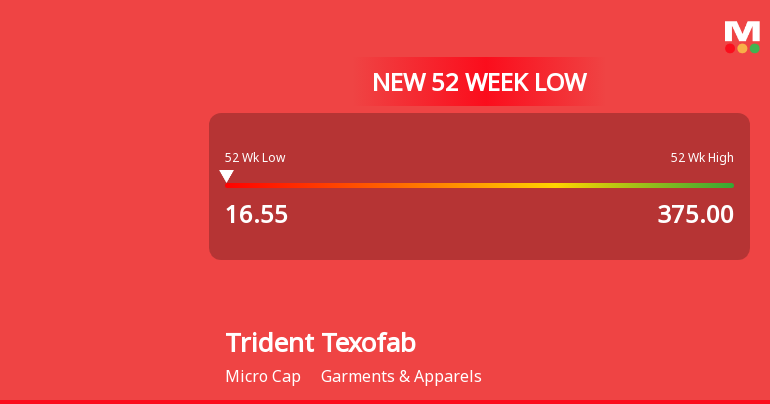
Announcements
Disclosures under Reg. 29(2) of SEBI (SAST) Regulations 2011
18-Nov-2026 | Source : BSEThe Exchange has received the disclosure under Regulation 29(2) of SEBI (Substantial Acquisition of Shares & Takeovers) Regulations 2011 for Hardik Desai Family Trust
Announcement under Regulation 30 (LODR)-Newspaper Publication
07-Nov-2026 | Source : BSEPursuant to Regulation 30 read with Schedule III Part A Para A and Regulation 47 of SEBI Listing Regulations we hereby enclose copies of newspaper advertisement published on November 07 2026 regarding extract of the Un-Audited Standalone Financial Results for the quarter and Half year ended September 30 2026
Board Meeting Outcome for Outcome Of Board Meeting Held On 05.11.2026
05-Nov-2026 | Source : BSEOutcome of Board Meeting held on 05.11.2026
Corporate Actions

No Upcoming Board Meetings

Trident Texofab Ltd has declared 10% dividend, ex-date: 18 Jul 19

No Splits history available

Trident Texofab Ltd has announced 14:10 bonus issue, ex-date: 11 Aug 20

No Rights history available
Key FactorsQuality key factors
Valuation key factors
Technicals key factors
 Technical Indicator Scale: Bearish, Mildly Bearish, Sideways, Mildly Bullish, Bullish Turned Shareholding
Shareholding Snapshot : Sep 2026
Shareholding Compare (%holding)
Non Institution
None
Held by 0 Schemes
Held by 0 FIIs
Hardik Jigishkumar Desai (14.15%)
Maulik Harendra Bandhara (2.86%)
59.69%
FinancialQuarterly Results Snapshot (Standalone) - Sep'26 - YoY
 Compare with Peers

YoY Growth in quarter ended Sep 2026 is -17.27% vs 15.80% in Sep 2025
YoY Growth in quarter ended Sep 2026 is -46.90% vs 13.00% in Sep 2025

Half Yearly Results Snapshot (Standalone) - Sep'25
Growth in half year ended Sep 2025 is 12.56% vs 12.66% in Sep 2024
Growth in half year ended Sep 2025 is 25.88% vs 174.19% in Sep 2024
Nine Monthly Results Snapshot (Standalone) - Dec'25
YoY Growth in nine months ended Dec 2025 is 0.72% vs 20.98% in Dec 2024
YoY Growth in nine months ended Dec 2025 is 35.50% vs 69.49% in Dec 2024
Annual Results Snapshot (Standalone) - Mar'26
YoY Growth in year ended Mar 2026 is -3.31% vs 22.70% in Mar 2025
YoY Growth in year ended Mar 2026 is -72.11% vs 132.41% in Mar 2025
 Company CV
About Trident Texofab Ltd

Company Coordinates


