
 Score
Dashboard
Low ability to service debt as the company has a high Debt to EBITDA ratio of 3.94 times
- Low ability to service debt as the company has a high Debt to EBITDA ratio of 3.94 times
- The company has been able to generate a Return on Equity (avg) of 12.25% signifying low profitability per unit of shareholders funds
- PAT(Q) At Rs 14.27 cr has Fallen at -54.7%
- OPERATING PROFIT TO INTEREST (Q) Lowest at 2.40 times
- DPR(Y) Lowest at 8.25%
Stock is technically in a Mildly Bullish range
With ROCE of 18.7, it has a Attractive valuation with a 2.6 Enterprise value to Capital Employed
Falling Participation by Institutional Investors
Mojo ParametersStock DNA

Gems, Jewellery And Watches

INR 3,643 Cr (Micro Cap)

19.00
41

0.43%

1.03

22.56%

4.43
Total ReturnsTotal Returns (Price + Dividend) 
Latest dividend: 2.5 per share ex-dividend date: Sep-02-2026
Risk Adjusted Returns v/s
Returns Beta
 News & Corporate Actions
News
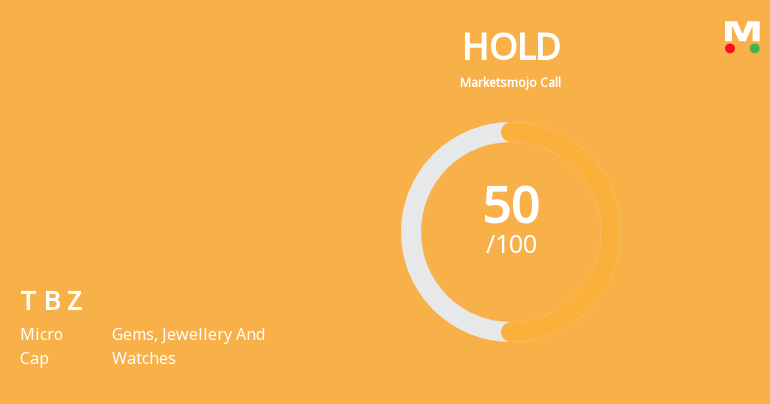
Tribhovandas Bhimji Zaveri Ltd is Rated Hold by MarketsMOJO
Tribhovandas Bhimji Zaveri Ltd is rated 'Hold' by MarketsMOJO, with this rating last updated on 27 October 2026. However, the analysis and financial metrics discussed below reflect the company’s current position as of 20 November 2026, providing investors with an up-to-date view of the stock’s fundamentals, valuation, financial trends, and technical outlook.
Read More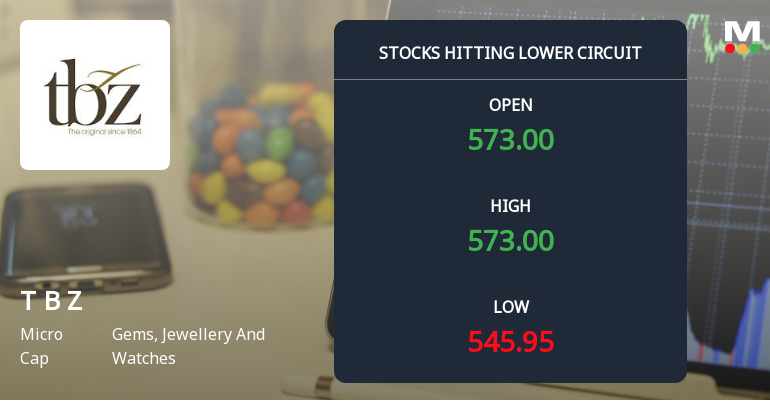
Below All Moving Averages and Now at Lower Circuit: Tribhovandas Bhimji Zaveri Ltd Loses 5.0% in a Single Session
At Rs 546.80, sellers were still queuing — but there were no buyers willing to take the other side. Tribhovandas Bhimji Zaveri Ltd locked at its lower circuit of 5.0% on 20 Nov 2026, with unfilled sell orders and a frozen price, signalling a pronounced imbalance in supply and demand.
Read More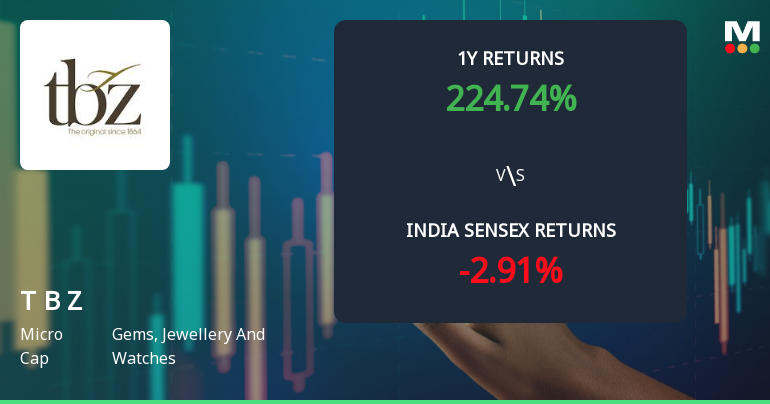
Tribhovandas Bhimji Zaveri Ltd Technical Momentum Shifts Amid Mixed Indicator Signals
Tribhovandas Bhimji Zaveri Ltd (TBZ), a micro-cap player in the Gems, Jewellery and Watches sector, has experienced a notable shift in its technical momentum, transitioning from a bullish to a mildly bullish trend. Despite a recent downgrade in its Mojo Grade from Buy to Hold, the stock’s price action and technical indicators present a nuanced picture, reflecting both resilience and caution for investors navigating the current market environment.
Read More Announcements
Announcement under Regulation 30 (LODR)-Newspaper Publication
07-Nov-2026 | Source : BSENewspaper advertisement relating Postal Ballot notice
Shareholder Meeting / Postal Ballot-Notice of Postal Ballot
06-Nov-2026 | Source : BSEPostal Ballot Notice
Disclosure In Terms Of Regulation 7(2) Of The SEBI (Prohibition Of Insider Trading) Regulations 2015
04-Nov-2026 | Source : BSEDisclosure in terms of Regulation 7(2) of SEBI (Prohibition of Insider Trading) Regulations 2015
Corporate Actions

No Upcoming Board Meetings

Tribhovandas Bhimji Zaveri Ltd has declared 25% dividend, ex-date: 02 Sep 26

No Splits history available

No Bonus history available

No Rights history available
Key FactorsQuality key factors
Valuation key factors
Technicals key factors
 Technical Indicator Scale: Bearish, Mildly Bearish, Sideways, Mildly Bullish, Bullish Turned Shareholding
Shareholding Snapshot : Sep 2026
Shareholding Compare (%holding)
Promoters
None
Held by 0 Schemes
Held by 4 FIIs (0.45%)
Shrikant Gopaldas Zaveri (50.06%)
Vanaja Sundar Iyer (1.57%)
20.3%
FinancialQuarterly Results Snapshot (Consolidated) - Sep'26 - YoY
 Compare with Peers

YoY Growth in quarter ended Sep 2026 is 2.55% vs 21.30% in Sep 2025
YoY Growth in quarter ended Sep 2026 is -54.74% vs 163.41% in Sep 2025

Half Yearly Results Snapshot (Consolidated) - Sep'25

Growth in half year ended Sep 2025 is 12.77% vs 10.64% in Sep 2024
Growth in half year ended Sep 2025 is 86.18% vs 42.39% in Sep 2024
Nine Monthly Results Snapshot (Consolidated) - Dec'25
YoY Growth in nine months ended Dec 2025 is 13.49% vs 16.67% in Dec 2024
YoY Growth in nine months ended Dec 2025 is 128.62% vs 40.84% in Dec 2024
Annual Results Snapshot (Consolidated) - Mar'26
YoY Growth in year ended Mar 2026 is 22.23% vs 13.99% in Mar 2025
YoY Growth in year ended Mar 2026 is 195.82% vs 25.65% in Mar 2025
 Company CV
About Tribhovandas Bhimji Zaveri Ltd

Company Coordinates


