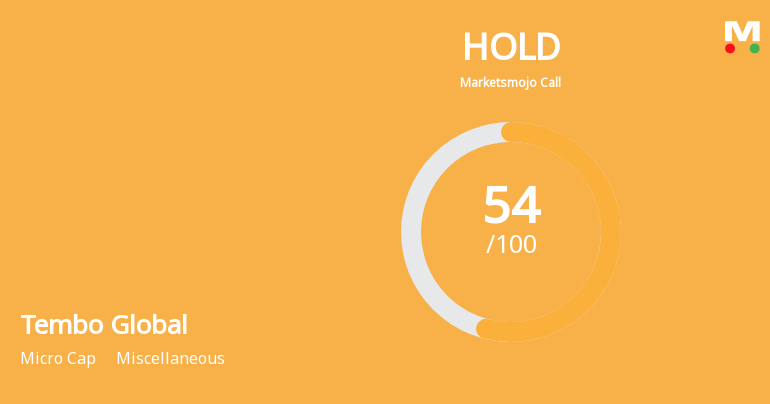
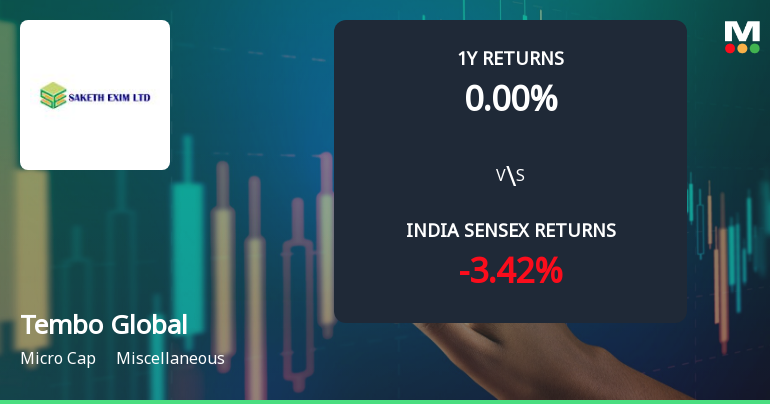
Tembo Global

  • Market Cap: Micro Cap
  • Industry: Miscellaneous
  • ISIN: INE869Y01028
  • NSEID: TEMBO
  • BSEID: 544987
INR
49.83
-1.68 (-3.26%)
BSENSE

Nov 20

BSE+NSE Vol: 11.83 lacs

  • Price Points
  • Score
  • Mojo Parameters
  • Total Return
  • News and Corporate Actions
  • Key factors
  • Shareholding
  • Financials
  • CompanyCV
stock-summaryPrice Point
High/Low

1Day

52 Week

Valuation
Technical
Day's Volume

CASH

11.83 lacs (1.01%) Volume

Shareholding (Jul 2026)

FII

8.39%

Held by 13 FIIs

DII

1.55%

Held by 0 DIIs

Promoter

39.04%

Who are in the management team of Tembo Global?

06-Jun-2025

As of March 2020, the management team of Tembo Global includes Sanjay J Patel (Managing Director), Smita S Patel (Chairman), Taruna P Patel (Director), and independent directors Jasbir A Singh and Jehan D Variava, along with Company Secretary Tasneem Marfatia. They are responsible for overseeing the company's operations and governance.

As of March 2020, the management team of Tembo Global includes the following individuals:<BR><BR>1. Sanjay J Patel - Managing Director<BR>2. Smita S Patel - Chairman<BR>3. Taruna P Patel - Director<BR>4. Jasbir A Singh - Independent Director<BR>5. Jehan D Variava - Independent Director<BR>6. Tasneem Marfatia - Company Secretary<BR><BR>These members play key roles in overseeing the company's operations and governance.

Read More

When is the next results date for Tembo Global?

06-Jun-2025

No Upcoming Board Meetings

What is the bonus history of the Tembo Global?

06-Jun-2025

Tembo Global Industries Ltd issued a 1:1 bonus share on March 3, 2021, with a record date of March 4, 2021, meaning shareholders received one additional share for each share owned as of the record date.

Tembo Global Industries Ltd has a bonus history that includes a 1:1 bonus issue announced with an ex-date of March 3, 2021. The record date for this bonus was March 4, 2021. This means that shareholders received one additional share for every share they owned as of the record date. If you have any more questions about Tembo Global or its financial activities, feel free to ask!

Read More

Has Tembo Global declared dividend?

06-Jun-2025

Yes, Tembo Global Industries Ltd has declared a 10% dividend, amounting to 1 per share, with an ex-date of February 14, 2025. Total returns have varied significantly, with a recent 6-month price return of -38.64%, but strong long-term returns, including a 5-year total return of 630.93%.

Tembo Global Industries Ltd has declared a 10% dividend.<BR><BR>Dividend Details:<BR>- Percentage announced: 10%<BR>- Amount per share: 1 per share<BR>- Ex-date: 14 Feb 25<BR><BR>Dividend Yield: 0.63%.<BR><BR>Total Returns by Period:<BR>In the 6-month period, the price return was -38.64%, the dividend return was 0.13%, resulting in a total return of -38.51%.<BR><BR>For the 1-year period, the price return was 102.84%, the dividend return was 1.30%, leading to a total return of 104.14%.<BR><BR>Over the 2-year period, the price return was 107.81%, the dividend return was 1.86%, which culminated in a total return of 109.67%.<BR><BR>In the 3-year period, the price return was 217.49%, with a dividend return of 4.48%, resulting in a total return of 221.97%.<BR><BR>For the 4-year period, the price return was 157.52%, the dividend return was 3.49%, leading to a total return of 161.01%.<BR><BR>Finally, in the 5-year period, the price return was 624.62%, the dividend return was 6.31%, culminating in a total return of 630.93%.<BR><BR>Overall, Tembo Global has declared a dividend, and the total returns over various periods show significant variability, with particularly strong returns over the longer term despite a recent negative price return in the 6-month period.

Read More

Who are the peers of the Tembo Global?

16-Jul-2025

Tembo Global's peers include Trident Techlabs, Linc, Repro India, S Chand & Compan, Vertoz, Vinyl Chemicals, Shankar Lal Ram., A-1, and Shiv Texchem. Tembo Global leads with a 1-year return of 121.46%, while A-1 has the lowest at 0.00%.

Peers: The peers of Tembo Global are Trident Techlabs, Linc, Repro India, S Chand & Compan, Vertoz, Vinyl Chemicals, Shankar Lal Ram., A-1, and Shiv Texchem.<BR><BR>Quality Snapshot: Excellent management risk is observed at Vertoz and Shiv Texchem, while Average management risk is found at Trident Techlabs, Linc, Repro India, S Chand & Compan, Tembo Global, Vinyl Chemicals, Shankar Lal Ram., A-1, and the rest. Growth is excellent at Tembo Global and Shiv Texchem, while below average growth is noted at Linc, Repro India, S Chand & Compan, A-1, and the rest. Capital structure is excellent at Linc, Vertoz, Vinyl Chemicals, and Shankar Lal Ram., while below average capital structure is seen at Tembo Global, A-1, and the rest.<BR><BR>Return Snapshot: The peer with the highest 1-year return is Tembo Global at 121.46%, while the peer with the lowest 1-year return is A-1 at 0.00%. Tembo Global's 1-year return is significantly higher than all its peers. Additionally, peers with negative six-month returns include Trident Techlabs, Vinyl Chemicals, and Everest Inds.

Read More

What does Tembo Global do?

17-Jul-2025

Tembo Global Industries Ltd, a micro-cap company incorporated in 2010, operates in the miscellaneous industry and reported net sales of 2,740 Cr and a net profit of 147 Cr for March 2025. The company has a market cap of INR 780 Cr and key financial metrics include a P/E of 15.00 and a dividend yield of 0.43%.

Overview:<BR>Tembo Global Industries Ltd operates in the miscellaneous industry and is categorized as a micro-cap company.<BR><BR>History:<BR>The company was incorporated in 2010 as a Private Limited Company under the name "Saketh Exim Private Limited." It transitioned to a Public Limited Company and changed its name to "Saketh Exim Limited" on December 19, 2017. The latest quarterly results reported net sales and profit for March 2025.<BR><BR>Financial Snapshot:<BR>- Net Sales: 2,740 Cr (Quarterly Results - Mar 2025)<BR>- Net Profit: 147 Cr (Quarterly Results - Mar 2025)<BR>- Market Cap: INR 780 Cr (Micro Cap)<BR><BR>Key Metrics:<BR>- P/E: 15.00<BR>- Industry P/E: 35<BR>- Dividend Yield: 0.43%<BR>- Debt Equity: 1.21<BR>- Return on Equity: 24.12%<BR>- Price to Book: 3.69<BR><BR>Contact Details:<BR>Address: Plot No- Pap D-146/147, Ttc Midc, Turbhe, Navi Mumbai Maharashtra : 400705<BR>Tel: +91 022 2762 0641/42/43<BR>Email: info@sakethexim.com<BR>Website: www.sakethexim.com

Read More

Who are the top shareholders of the Tembo Global?

17-Jul-2025

The top shareholders of Tembo Global include Fatema Shabbir Kachwala with 19.07%, Murtuza Z Mandsaurwalla at 4.85%, and individual investors holding 48.65%. There are also 2 foreign institutional investors with a total of 0.08%, and no mutual funds are currently invested in the company.

The top shareholders of Tembo Global include Fatema Shabbir Kachwala, who holds the highest promoter stake at 19.07%. The next significant public shareholder is Murtuza Z Mandsaurwalla, with a holding of 4.85%. Additionally, individual investors collectively own 48.65% of the company. The company also has 2 foreign institutional investors (FIIs) holding a total of 0.08%, while there are no mutual funds currently invested in Tembo Global.

Read More

How big is Tembo Global?

24-Jul-2025

As of 24th July, Tembo Global Industries Ltd has a market capitalization of 744.00 Cr, with recent Net Sales of 730.75 Cr and a Net Profit of 50.97 Cr. As of March 2023, Shareholder's Funds are 39.88 Cr and Total Assets are 109.60 Cr.

As of 24th July, Tembo Global Industries Ltd has a market capitalization of 744.00 Cr, categorizing it as a Micro Cap company.<BR><BR>In the latest four quarters, Tembo Global reported Net Sales of 730.75 Cr and a Net Profit of 50.97 Cr.<BR><BR>The latest annual period for the balance sheet is March 2023, with Shareholder's Funds amounting to 39.88 Cr and Total Assets of 109.60 Cr.

Read More

How has been the historical performance of Tembo Global?

15-Nov-2025

Tembo Global has shown significant growth from March 2020 to March 2025, with net sales increasing from 78.73 Cr to 743.25 Cr and profit after tax rising from 2.39 Cr to 54.13 Cr, indicating a strong upward trend in both revenue and profitability. Total assets also grew from 50.41 Cr to 109.60 Cr during this period.

Answer:<BR>The historical performance of Tembo Global shows significant growth in net sales and profitability over the years, particularly from March 2020 to March 2025.<BR><BR>Breakdown:<BR>Tembo Global's net sales have increased dramatically from 78.73 Cr in March 2020 to 743.25 Cr in March 2025, reflecting a strong upward trend. Total operating income has followed suit, rising from 78.73 Cr in March 2020 to 743.25 Cr in March 2025. The company's total expenditure, excluding depreciation, also rose significantly from 73.06 Cr in March 2020 to 651.58 Cr in March 2025, driven by increased raw material costs and purchases of finished goods. Operating profit (PBDIT) has shown a remarkable increase, climbing from 5.67 Cr in March 2020 to 91.67 Cr in March 2025, with a corresponding rise in profit before tax from 3.29 Cr to 75.61 Cr during the same period. Profit after tax has surged from 2.39 Cr in March 2020 to 54.13 Cr in March 2025, indicating a robust growth in profitability. The earnings per share (EPS) have also improved significantly, reaching 32.95 in March 2025 from 2.38 in March 2020. On the balance sheet, total assets increased from 50.41 Cr in March 2020 to 109.60 Cr in March 2023, while total liabilities rose from 41.00 Cr to 109.60 Cr, reflecting the company's expanding operations. Overall, Tembo Global has demonstrated a strong growth trajectory in both revenue and profitability over the past several years.

Read More

Should I buy, sell or hold Tembo Global?

16-Nov-2025

Is Tembo Global overvalued or undervalued?

18-Nov-2025

As of November 17, 2025, Tembo Global is considered undervalued with a PE ratio of 17.23 and strong growth potential, outperforming peers like PTC India and Elitecon International, and has achieved a 1-month stock return of 38.46% compared to the Sensex's 1.18%.

As of 17 November 2025, Tembo Global's valuation grade has moved from fair to attractive, indicating a positive shift in its perceived value. The company is currently considered undervalued, with a PE ratio of 17.23, an EV to EBITDA ratio of 12.53, and a PEG ratio of 0.20, which suggests strong growth potential relative to its price. <BR><BR>In comparison to its peers, Tembo Global's valuation metrics stand out, particularly when contrasted with PTC India, which has a significantly lower PE ratio of 7.56 and an EV to EBITDA of 2.45, indicating that Tembo is positioned favorably within its industry. Additionally, while Elitecon International is categorized as very expensive with a PE ratio of 294.38, Tembo's metrics suggest it offers a more attractive investment opportunity. Notably, Tembo Global has outperformed the Sensex in the short term, with a 1-month stock return of 38.46% compared to the Sensex's 1.18%.

Read More

Is Tembo Global technically bullish or bearish?

03-Dec-2025

As of December 2, 2025, Tembo Global's trend is mildly bullish, supported by bullish MACD and moving averages, but caution is advised due to mildly bearish signals from KST and Dow Theory.

As of 2 December 2025, the technical trend for Tembo Global has changed from bullish to mildly bullish. The current stance is mildly bullish, supported by a bullish MACD on both weekly and monthly time frames, and bullish moving averages on the daily chart. However, the KST indicates a mildly bearish trend on the monthly, and Dow Theory shows a mildly bearish stance on the weekly. The Bollinger Bands are also mildly bullish on both weekly and monthly time frames. Overall, while there are some bullish indicators, the presence of bearish signals in KST and Dow Theory suggests caution.

Read More

Why is Tembo Global falling/rising?

03-Dec-2025

As of 03-Dec, Tembo Global Industries Ltd's stock price is rising to 727.35, driven by strong long-term growth, consistent positive quarterly results, high return on capital employed, and increased promoter stake. Despite a drop in investor participation, the stock has outperformed its sector, reflecting strong investor confidence.

As of 03-Dec, Tembo Global Industries Ltd's stock price is rising, currently at 727.35, reflecting a change of 10.15 (1.42%) upwards. This positive movement can be attributed to several factors. Firstly, the company has demonstrated healthy long-term growth, with net sales increasing at an annual rate of 59.39% and operating profit growing by 19%. The company has also reported positive results for the last 16 consecutive quarters, which builds investor confidence.<BR><BR>Moreover, the return on capital employed (ROCE) is notably high at 23.96%, indicating efficient use of capital. The stock is trading at a discount compared to its peers' average historical valuations, which may attract investors looking for value. Additionally, the promoters have increased their stake in the company by 2.21% over the previous quarter, now holding 43.62% of the company, signaling strong confidence in the business's future prospects.<BR><BR>Despite a recent decline in investor participation, with delivery volume falling by 54.67% against the 5-day average, the stock has outperformed its sector by 2.21% today. This combination of strong financial performance, attractive valuation, and rising promoter confidence contributes to the upward movement in Tembo Global's stock price.

Read More
iScoreScore
Click here to find our call on this stock
Strong Sell
Sell
Hold
Buy
Strong Buy
Dashboard
1

Healthy long term growth as Net Sales has grown by an annual rate of 52.87% and Operating profit at 76.54%

 
2

Positive results in Jun 26

3

With ROCE of 19.8, it has a Attractive valuation with a 1.7 Enterprise value to Capital Employed

stock-summaryMojo Parameters
Mojo Parameters
Loading Valuation Snapshot...
Stock DNA
stock-summary
Industry

Miscellaneous

stock-summary
Market cap

INR 948 Cr (Micro Cap)

stock-summary
P/E

9.00

stock-summary
Industry P/E

19

stock-summary
Dividend Yield

0.19%

stock-summary
Debt Equity

0.52

stock-summary
Return on Equity

20.19%

stock-summary
Price to Book

2.11

Revenue and Profits:
Net Sales:
302 Cr
(Quarterly Results - Jun 2026)
Net Profit:
30 Cr
stock-summaryTotal Returns
Total Returns (Price + Dividend) stock-summary
Icon
Company does not have enough history
Risk Adjusted Returns v/s stock-summary
Returns Beta
Icon
Beta has not been calculated since enough price history is not available
stock-summaryNews & Corporate Actions
News
Announcements stock-summary

Announcement under Regulation 30 (LODR)-Newspaper Publication

16-Nov-2026 | Source : BSE

Newspaper Advertisement of unaudited financial results of the company for the quarter and half year ended September 30 2026

Announcement under Regulation 30 (LODR)-Press Release / Media Release

14-Nov-2026 | Source : BSE

Tembo Global Industries Records Highest-ever Revenue and Profitability in H1FY27

Board Meeting Outcome for Outcome Of The Board Meeting Held On 13Th November 2026

13-Nov-2026 | Source : BSE

Please note that the Board of Directors of the Company (the Board) at its meeting held today i.e.

Corporate Actions stock-summary
stock-summary
BOARD MEETING

No Upcoming Board Meetings

stock-summary
DIVIDEND

Tembo Global Industries Ltd has declared 10% dividend, ex-date: 16 Jan 26

stock-summary
SPLITS

Tembo Global Industries Ltd has announced 1:10 stock split, ex-date: 05 Aug 26

stock-summary
BONUS

Tembo Global Industries Ltd has announced 1:1 bonus issue, ex-date: 03 Mar 21

stock-summary
RIGHTS

Tembo Global Industries Ltd has announced 25:9 rights issue, ex-date: 08 Aug 22

stock-summaryKey Factors
Quality key factors stock-summary
Factor
Value
Sales Growth (5y)
52.87%
EBIT Growth (5y)
76.54%
EBIT to Interest (avg)
3.91
Debt to EBITDA (avg)
3.77
Net Debt to Equity (avg)
0.52
Sales to Capital Employed (avg)
2.36
Tax Ratio
25.80%
Dividend Payout Ratio
3.03%
Pledged Shares
40.65%
Institutional Holding
9.94%
ROCE (avg)
14.60%
ROE (avg)
18.58%
Valuation key factors
Factor
Value
P/E Ratio
9
Industry P/E
19
Price to Book Value
2.03
EV to EBIT
7.46
EV to EBITDA
7.06
EV to Capital Employed
1.68
EV to Sales
1.01
PEG Ratio
0.33
Dividend Yield
0.20%
ROCE (Latest)
19.76%
ROE (Latest)
20.19%
Technicals key factors
Indicator
Weekly
Monthly
MACD
RSI
Bollinger Bands
KST
Dow Theory
OBV
stock-summary Technical Indicator Scale: Bearish, Mildly Bearish, Sideways, Mildly Bullish, Bullish  Turned 
stock-summaryShareholding
Shareholding Snapshot : Jul 2026stock-summary
Shareholding Compare (%holding) stock-summary
Majority shareholders

Non Institution

Pledged Promoter Holdings

40.6544

Mutual Funds

Held by 0 Schemes

FIIs

Held by 13 FIIs (8.39%)

Promoter with highest holding

Fatema Shabbir Kachwala (15.56%)

Highest Public shareholder

Murtuza Z Mandsaurwalla (3.42%)

Individual Investors Holdings

40.26%

stock-summaryFinancial
[
  {
    "link": "quarterly",
    "btn_text": "All Quarterly Results",
    "header": "Quarterly Results Snapshot (Consolidated) - Jun'26 - QoQ",
    "rhs": [
      {
        "prefix": "Net Sales ",
        "suffix": "QoQ Growth in quarter ended Jun 2026 is -12.61% vs 38.00% in Mar 2026",
        "dir": -1
      },
      {
        "prefix": "Consolidated Net Profit ",
        "suffix": "QoQ Growth in quarter ended Jun 2026 is 11.67% vs 6.28% in Mar 2026",
        "dir": 1
      }
    ],
    "table": {
      "header": [
        "Jun'26",
        "Mar'26",
        "Change(%)"
      ],
      "body": [
        {
          "field": "Net Sales",
          "val1": "302.35",
          "val2": "345.96",
          "chgp": "-12.61%",
          "chgp_class": "negative"
        },
        {
          "field": "Operating Profit (PBDIT) excl Other Income",
          "val1": "49.24",
          "val2": "39.02",
          "chgp": "26.19%",
          "chgp_class": "positive"
        },
        {
          "field": "Interest",
          "val1": "5.90",
          "val2": "8.54",
          "chgp": "-30.91%",
          "chgp_class": "positive"
        },
        {
          "field": "Exceptional Items",
          "val1": "0.00",
          "val2": "0.00",
          "chgp": "",
          "chgp_class": "neutral"
        },
        {
          "field": "Consolidate Net Profit",
          "val1": "30.05",
          "val2": "26.91",
          "chgp": "11.67%",
          "chgp_class": "positive"
        },
        {
          "field": "Operating Profit Margin (Excl OI)",
          "val1": "16.29%",
          "val2": "11.28%",
          "chgp": "5.01%",
          "chgp_class": "positive"
        }
      ]
    }
  },
  {
    "link": "half-yearly",
    "btn_text": "All Half Yearly Results",
    "header": "Half Yearly Results Snapshot (Consolidated) - Sep'25",
    "rhs": [
      {
        "prefix": "Net Sales ",
        "suffix": " Growth in half year ended Sep 2025 is 68.87% vs 49.84% in Sep 2024",
        "dir": 1
      },
      {
        "prefix": "Consolidated Net Profit ",
        "suffix": " Growth in half year ended Sep 2025 is 95.50% vs 181.69% in Sep 2024",
        "dir": -1
      }
    ],
    "table": {
      "header": [
        "Sep'25",
        "Sep'24",
        "Change(%)"
      ],
      "body": [
        {
          "field": "Net Sales",
          "val1": "493.53",
          "val2": "292.26",
          "chgp": "68.87%",
          "chgp_class": "positive"
        },
        {
          "field": "Operating Profit (PBDIT) excl Other Income",
          "val1": "61.34",
          "val2": "23.04",
          "chgp": "166.23%",
          "chgp_class": "positive"
        },
        {
          "field": "Interest",
          "val1": "11.65",
          "val2": "6.03",
          "chgp": "93.20%",
          "chgp_class": "negative"
        },
        {
          "field": "Exceptional Items",
          "val1": "0.00",
          "val2": "0.00",
          "chgp": "",
          "chgp_class": "neutral"
        },
        {
          "field": "Consolidate Net Profit",
          "val1": "39.10",
          "val2": "20.00",
          "chgp": "95.50%",
          "chgp_class": "positive"
        },
        {
          "field": "Operating Profit Margin (Excl OI)",
          "val1": "12.43%",
          "val2": "7.88%",
          "chgp": "4.55%",
          "chgp_class": "positive"
        }
      ]
    }
  },
  {
    "link": "nine-monthly",
    "btn_text": "All Nine Monthly Results",
    "header": "Nine Monthly Results Snapshot (Consolidated) - Dec'25",
    "rhs": [
      {
        "prefix": "Net Sales ",
        "suffix": "YoY Growth in nine months ended Dec 2025 is 61.81% vs 48.17% in Dec 2024",
        "dir": 1
      },
      {
        "prefix": "Consolidated Net Profit ",
        "suffix": "YoY Growth in nine months ended Dec 2025 is 77.42% vs 214.37% in Dec 2024",
        "dir": -1
      }
    ],
    "table": {
      "header": [
        "Dec'25",
        "Dec'24",
        "Change(%)"
      ],
      "body": [
        {
          "field": "Net Sales",
          "val1": "744.23",
          "val2": "459.95",
          "chgp": "61.81%",
          "chgp_class": "positive"
        },
        {
          "field": "Operating Profit (PBDIT) excl Other Income",
          "val1": "104.57",
          "val2": "53.51",
          "chgp": "95.42%",
          "chgp_class": "positive"
        },
        {
          "field": "Interest",
          "val1": "17.55",
          "val2": "11.70",
          "chgp": "50.00%",
          "chgp_class": "negative"
        },
        {
          "field": "Exceptional Items",
          "val1": "0.00",
          "val2": "0.00",
          "chgp": "",
          "chgp_class": "neutral"
        },
        {
          "field": "Consolidate Net Profit",
          "val1": "64.42",
          "val2": "36.31",
          "chgp": "77.42%",
          "chgp_class": "positive"
        },
        {
          "field": "Operating Profit Margin (Excl OI)",
          "val1": "14.05%",
          "val2": "11.63%",
          "chgp": "2.42%",
          "chgp_class": "positive"
        }
      ]
    }
  },
  {
    "link": "annual",
    "btn_text": "All Annual Results",
    "header": "Annual Results Snapshot (Consolidated) - Mar'26",
    "rhs": [
      {
        "prefix": "Net Sales ",
        "suffix": "YoY Growth in year ended Mar 2026 is 46.68% vs 69.49% in Mar 2025",
        "dir": -1
      },
      {
        "prefix": "Consolidated Net Profit ",
        "suffix": "YoY Growth in year ended Mar 2026 is 79.18% vs 258.69% in Mar 2025",
        "dir": -1
      }
    ],
    "table": {
      "header": [
        "Mar'26",
        "Mar'25",
        "Change(%)"
      ],
      "body": [
        {
          "field": "Net Sales",
          "val1": "1,090.19",
          "val2": "743.25",
          "chgp": "46.68%",
          "chgp_class": "positive"
        },
        {
          "field": "Operating Profit (PBDIT) excl Other Income",
          "val1": "142.49",
          "val2": "91.67",
          "chgp": "55.44%",
          "chgp_class": "positive"
        },
        {
          "field": "Interest",
          "val1": "25.01",
          "val2": "16.84",
          "chgp": "48.52%",
          "chgp_class": "negative"
        },
        {
          "field": "Exceptional Items",
          "val1": "0.00",
          "val2": "0.00",
          "chgp": "",
          "chgp_class": "neutral"
        },
        {
          "field": "Consolidate Net Profit",
          "val1": "91.33",
          "val2": "50.97",
          "chgp": "79.18%",
          "chgp_class": "positive"
        },
        {
          "field": "Operating Profit Margin (Excl OI)",
          "val1": "13.07%",
          "val2": "12.33%",
          "chgp": "0.74%",
          "chgp_class": "positive"
        }
      ]
    }
  }
]
Quarterly Results Snapshot (Consolidated) - Jun'26 - QoQstock-summary
Jun'26
Mar'26
Change(%)
Net Sales
302.35
345.96
-12.61%
Operating Profit (PBDIT) excl Other Income
49.24
39.02
26.19%
Interest
5.90
8.54
-30.91%
Exceptional Items
0.00
0.00
Consolidate Net Profit
30.05
26.91
11.67%
Operating Profit Margin (Excl OI)
16.29%
11.28%
5.01%
Values in Rs Cr.
Direction Arrows
Net Sales

QoQ Growth in quarter ended Jun 2026 is -12.61% vs 38.00% in Mar 2026

Direction Arrows
Consolidated Net Profit

QoQ Growth in quarter ended Jun 2026 is 11.67% vs 6.28% in Mar 2026

Half Yearly Results Snapshot (Consolidated) - Sep'25stock-summary
Sep'25
Sep'24
Change(%)
Net Sales
493.53
292.26
68.87%
Operating Profit (PBDIT) excl Other Income
61.34
23.04
166.23%
Interest
11.65
6.03
93.20%
Exceptional Items
0.00
0.00
Consolidate Net Profit
39.10
20.00
95.50%
Operating Profit Margin (Excl OI)
12.43%
7.88%
4.55%
Values in Rs Cr.
Direction Arrows
Net Sales

Growth in half year ended Sep 2025 is 68.87% vs 49.84% in Sep 2024

Direction Arrows
Consolidated Net Profit

Growth in half year ended Sep 2025 is 95.50% vs 181.69% in Sep 2024

Nine Monthly Results Snapshot (Consolidated) - Dec'25stock-summary
Dec'25
Dec'24
Change(%)
Net Sales
744.23
459.95
61.81%
Operating Profit (PBDIT) excl Other Income
104.57
53.51
95.42%
Interest
17.55
11.70
50.00%
Exceptional Items
0.00
0.00
Consolidate Net Profit
64.42
36.31
77.42%
Operating Profit Margin (Excl OI)
14.05%
11.63%
2.42%
Values in Rs Cr.
Direction Arrows
Net Sales

YoY Growth in nine months ended Dec 2025 is 61.81% vs 48.17% in Dec 2024

Direction Arrows
Consolidated Net Profit

YoY Growth in nine months ended Dec 2025 is 77.42% vs 214.37% in Dec 2024

Annual Results Snapshot (Consolidated) - Mar'26stock-summary
Mar'26
Mar'25
Change(%)
Net Sales
1,090.19
743.25
46.68%
Operating Profit (PBDIT) excl Other Income
142.49
91.67
55.44%
Interest
25.01
16.84
48.52%
Exceptional Items
0.00
0.00
Consolidate Net Profit
91.33
50.97
79.18%
Operating Profit Margin (Excl OI)
13.07%
12.33%
0.74%
Values in Rs Cr.
Direction Arrows
Net Sales

YoY Growth in year ended Mar 2026 is 46.68% vs 69.49% in Mar 2025

Direction Arrows
Consolidated Net Profit

YoY Growth in year ended Mar 2026 is 79.18% vs 258.69% in Mar 2025

stock-summaryCompany CV
About Tembo Global Industries Ltd stock-summary
stock-summary
Tembo Global Industries Ltd
Micro Cap
Miscellaneous
Tembo Global Industries Limited was formerly incorporated as a Private Limited Company with the name "Saketh Exim Private Limited" on June 16, 2010. Subsequently, the status of the Company was changed to a Public Limited Company and the name of the Company was changed to "Saketh Exim Limited" on December 19, 2017.
Company Coordinates stock-summary
Company Details
Plot No- Pap D-146/147, Ttc Midc, Turbhe, Navi Mumbai Maharashtra : 400705
stock-summary
Tel: +91 022 2762 0641/42/43
stock-summary
info@sakethexim.com
Registrar Details
Bigshare Services Pvt Ltd , E-2 , Ansa Industrial Estate, Saki Vihar Road, Saki Naka, Andheri (E), Mumbai