
 Score
Dashboard
With HIgh Debt (Debt-Equity Ratio at 11.53 times)- the company has a Weak Long Term Fundamental Strength
- Poor long term growth as Net Sales has grown by an annual rate of 312.80% and Operating profit at 0% over the last 5 years
- High Debt Company with a Debt to Equity ratio (avg) at 0 times
Stock is technically in a Bearish range
Underperformed the market in the last 1 year
Mojo ParametersStock DNA

Software Products

INR 16 Cr (Micro Cap)

4.00
22

0.00%

11.53

718.00%

17.35
Total ReturnsTotal Returns (Price + Dividend) 
TeleCanor Global for the last several years.
Risk Adjusted Returns v/s
Returns Beta
 News & Corporate Actions
News
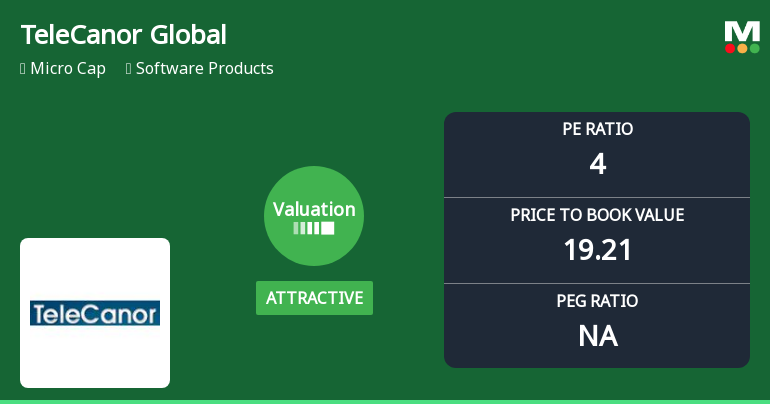
TeleCanor Global Ltd Valuation Shifts Signal Renewed Price Attractiveness Amid Market Challenges
TeleCanor Global Ltd, a micro-cap player in the Software Products sector, has seen a notable shift in its valuation parameters, moving from fair to attractive territory. Despite a challenging year marked by a 72.6% year-to-date decline in stock price, the company’s current price-to-earnings (P/E) and price-to-book value (P/BV) ratios suggest a compelling entry point relative to its historical averages and peer group.
Read More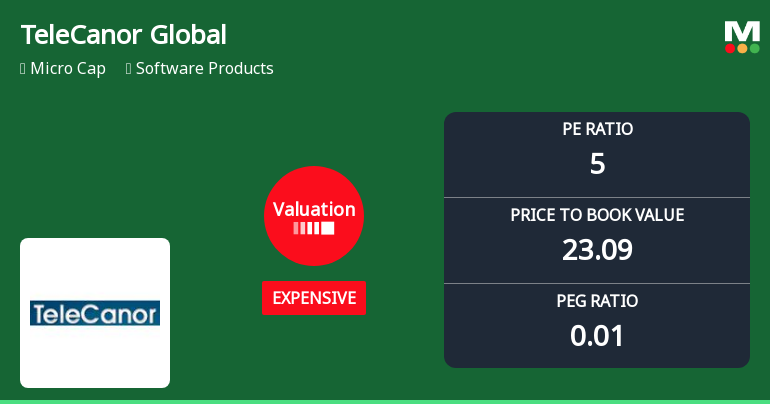
TeleCanor Global Ltd Faces Valuation Shift Amid Mixed Market Performance
TeleCanor Global Ltd, a micro-cap player in the Software Products sector, has seen its valuation parameters shift notably, with its price-to-earnings (P/E) and price-to-book value (P/BV) ratios moving from fair to expensive territory. This change, coupled with a recent downgrade in its Mojo Grade to Strong Sell, raises questions about the stock’s price attractiveness relative to its historical averages and peer group.
Read More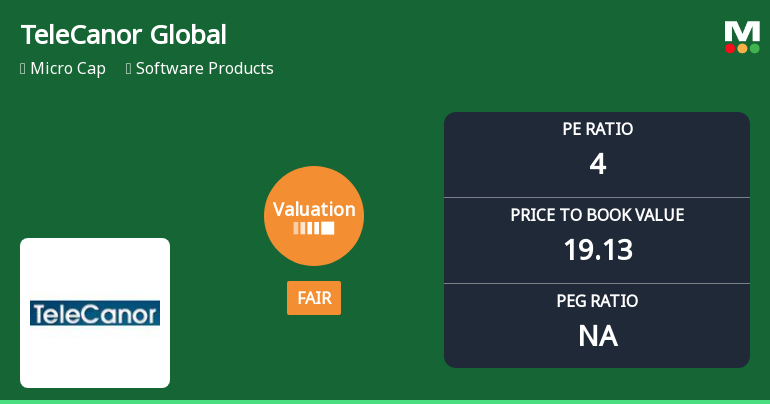
TeleCanor Global Ltd Valuation Shifts Signal Changing Market Sentiment
TeleCanor Global Ltd, a micro-cap player in the Software Products sector, has seen a notable shift in its valuation parameters, moving from an attractive to a fair rating. Despite a recent uptick in its share price, the company’s price-to-earnings (P/E) and price-to-book value (P/BV) ratios now reflect a more tempered market sentiment compared to its historical averages and peer group benchmarks.
Read More Announcements
Board Meeting Outcome for The Board Meeting For Considering The Unaudited Financial Results For The Quarter And Half Year Ending 30Th September 2026 Was Adjourned To Monday The 16Th November 2026 Due To Unavoidable Circumstances
14-Nov-2026 | Source : BSEThe board meeting for considering the unaudited financial results for the quarter and half year ending 30th September 2026 was adjourned to Monday the 16th November 2026 due to unavoidable circumstances
Company In Receipt Of Petition Filed Under Section 7 Of IBC Against The Company Which It Contends That A WP In Honble High Court Is Already Applied For
11-Nov-2026 | Source : BSECompany in receipt of Petition filed under section 7 of IBC against the Company which it contends that a WP in Honble High Court is already applied for
Shareholder Meeting / Postal Ballot-Scrutinizers Report
03-Nov-2026 | Source : BSEVoting Results and Scrutinizers Report
Corporate Actions

No Upcoming Board Meetings

No Dividend history available

No Splits history available

No Bonus history available

No Rights history available
Key FactorsQuality key factors
Valuation key factors
Technicals key factors
 Technical Indicator Scale: Bearish, Mildly Bearish, Sideways, Mildly Bullish, Bullish Turned Shareholding
Shareholding Snapshot : Sep 2026
Shareholding Compare (%holding)
Non Institution
12.453
Held by 1 Schemes (0.1%)
Held by 0 FIIs
Vijay Lakshmi Praturi (27.39%)
Hemant Kumar Gupta (10.83%)
62.42%
FinancialQuarterly Results Snapshot (Standalone) - Jun'26 - QoQ
 Compare with Peers

QoQ Growth in quarter ended Jun 2026 is 7.60% vs -61.72% in Mar 2026
QoQ Growth in quarter ended Jun 2026 is 93.20% vs -341.32% in Mar 2026

Half Yearly Results Snapshot (Standalone) - Sep'25
Growth in half year ended Sep 2025 is 2,715.38% vs 0.00% in Sep 2024
Growth in half year ended Sep 2025 is 489.55% vs -191.30% in Sep 2024
Nine Monthly Results Snapshot (Standalone) - Dec'25
YoY Growth in nine months ended Dec 2025 is 5,357.69% vs 0.00% in Dec 2024
YoY Growth in nine months ended Dec 2025 is 813.58% vs -145.45% in Dec 2024
Annual Results Snapshot (Standalone) - Mar'26

YoY Growth in year ended Mar 2026 is 308.52% vs 1,434.62% in Mar 2025
YoY Growth in year ended Mar 2026 is -84.42% vs 7,600.00% in Mar 2025
 Company CV
About TeleCanor Global Ltd

Company Coordinates


