
 Score
Dashboard
With a Operating Losses, the company has a Weak Long Term Fundamental Strength
- Poor long term growth as Operating profit has grown by an annual rate 10.01% of over the last 5 years
- Company's ability to service its debt is weak with a poor EBIT to Interest (avg) ratio of -1.11
Flat results in Sep 26
Stock is technically in a Mildly Bearish range
Risky - Negative EBITDA
Mojo ParametersStock DNA

Diversified Commercial Services

INR 112 Cr (Micro Cap)

NA (Loss Making)
63

0.00%

0.06

-3.32%

7.27
Total ReturnsTotal Returns (Price + Dividend) 
TCI Industries for the last several years.
Risk Adjusted Returns v/s
Returns Beta
 News & Corporate Actions
News
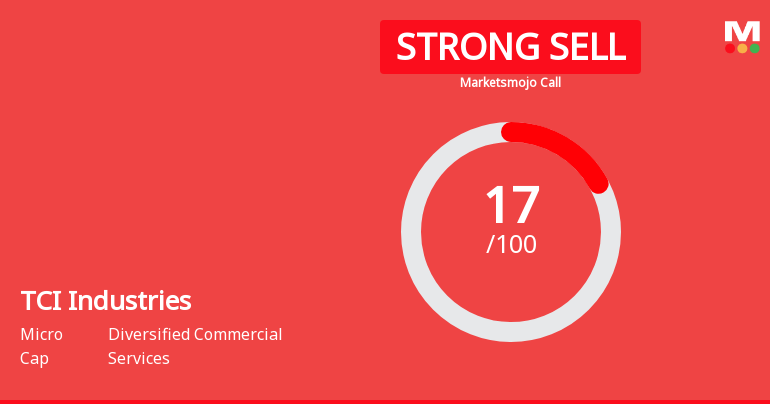
TCI Industries Ltd is Rated Strong Sell
TCI Industries Ltd is rated Strong Sell by MarketsMOJO, with this rating last updated on 12 August 2026. However, the analysis and financial metrics discussed here reflect the stock's current position as of 19 November 2026, providing investors with an up-to-date view of the company’s fundamentals, valuation, financial trend, and technical outlook.
Read More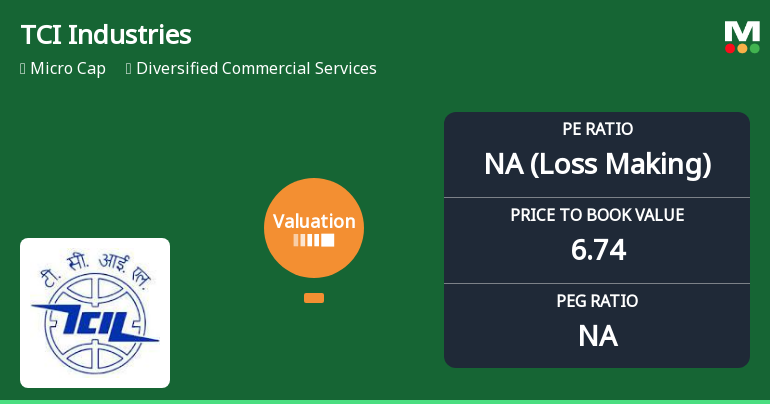
TCI Industries Ltd Faces Valuation Reassessment Amid Deteriorating Financial Metrics
TCI Industries Ltd has seen a marked deterioration in its valuation parameters, shifting from a previously expensive rating to a risky classification. This change reflects the company’s negative earnings metrics, poor return ratios, and unfavourable comparison with industry peers, signalling caution for investors amid a challenging market backdrop.
Read More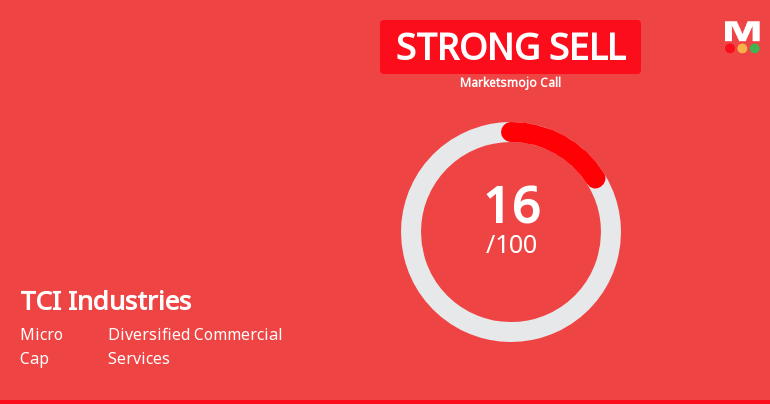
TCI Industries Ltd is Rated Strong Sell
TCI Industries Ltd is rated Strong Sell by MarketsMOJO, with this rating last updated on 12 August 2026. However, the analysis and financial metrics discussed here reflect the stock's current position as of 31 October 2026, providing investors with the latest insights into the company’s performance and outlook.
Read More Announcements
Announcement under Regulation 30 (LODR)-Newspaper Publication
05-Nov-2026 | Source : BSENewspaper publication of Unaudited Financial Results for quarter ended 30 September 2026
Results-Financial Results For Quarter And Half Year Ended 30 September 2026
03-Nov-2026 | Source : BSEPursuant to provisions of Regulations 30 and 33 of SEBI LODR 2015 please find enclosed herewith Unaudited Financial Results for the quarter and half year ended 30 September 2026 along with Limited Review Report
Board Meeting Outcome for Outcome Of Board Meeting Held On Tuesday 03 November 2026
03-Nov-2026 | Source : BSECompany at its meeting held on 03 November 2026 (i.e. today) inter-alia considered and approved the following:
Corporate Actions

No Upcoming Board Meetings

No Dividend history available

No Splits history available

No Bonus history available

No Rights history available
Key FactorsQuality key factors
Valuation key factors
Technicals key factors
 Technical Indicator Scale: Bearish, Mildly Bearish, Sideways, Mildly Bullish, Bullish Turned Shareholding
Shareholding Snapshot : Sep 2026
Shareholding Compare (%holding)
Promoters
7.2168
Held by 0 Schemes
Held by 2 FIIs (0.01%)
Mahendra Kumar Agarwal (7.36%)
None
14.39%
FinancialQuarterly Results Snapshot (Standalone) - Sep'26 - QoQ
 Compare with Peers

QoQ Growth in quarter ended Sep 2026 is -43.40% vs -70.06% in Jun 2026
QoQ Growth in quarter ended Sep 2026 is -33.33% vs -270.00% in Jun 2026

Half Yearly Results Snapshot (Standalone) - Sep'25
Growth in half year ended Sep 2025 is 124.36% vs 36.84% in Sep 2024
Growth in half year ended Sep 2025 is 72.97% vs -8.82% in Sep 2024
Nine Monthly Results Snapshot (Standalone) - Dec'25
YoY Growth in nine months ended Dec 2025 is 90.75% vs 88.04% in Dec 2024
YoY Growth in nine months ended Dec 2025 is 113.04% vs -66.27% in Dec 2024
Annual Results Snapshot (Standalone) - Mar'26

YoY Growth in year ended Mar 2026 is 78.80% vs 103.60% in Mar 2025
YoY Growth in year ended Mar 2026 is 121.88% vs -115.38% in Mar 2025
 Company CV
About TCI Industries Ltd

Company Coordinates


