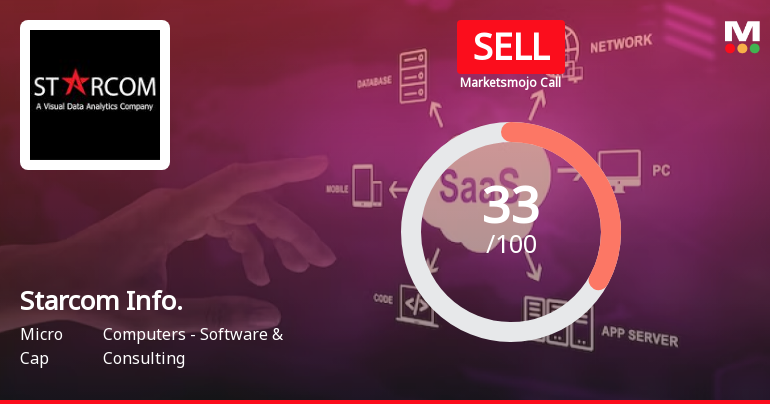
Starcom Info.

  • Market Cap: Micro Cap
  • Industry: Computers - Software & Consulting
  • ISIN: INE347I01010
  • NSEID:
  • BSEID: 531616
INR
83.63
0.00 (0.00%)
BSENSE

Nov 20

BSE+NSE Vol: 21

  • Price Points
  • Score
  • Mojo Parameters
  • Total Return
  • News and Corporate Actions
  • Key factors
  • Shareholding
  • Financials
  • CompanyCV
stock-summaryPrice Point
High/Low

1Day

52 Week

Valuation
Technical
Day's Volume

CASH

21.0 (400.00%) Volume

Shareholding (Sep 2026)

FII

6.98%

Held by 2 FIIs

DII

0.00%

Held by 0 DIIs

Promoter

45.17%

iScoreScore
Click here to find our call on this stock
Strong Sell
Sell
Hold
Buy
Strong Buy
Dashboard
Icon
Unrated Stock - No Analysis Available
stock-summaryMojo Parameters
Mojo Parameters
Loading Valuation Snapshot...
Stock DNA
stock-summary
Industry

Computers - Software & Consulting

stock-summary
Market cap

INR 46 Cr (Micro Cap)

stock-summary
P/E

NA (Loss Making)

stock-summary
Industry P/E

20

stock-summary
Dividend Yield

0.00%

stock-summary
Debt Equity

-0.60

stock-summary
Return on Equity

21.54%

stock-summary
Price to Book

-1.47

Revenue and Profits:
Net Sales:
0 Cr
(Quarterly Results - Sep 2026)
Net Profit:
-2 Cr
stock-summaryTotal Returns
Total Returns (Price + Dividend) stock-summary
Dividend Yield (0%)
TimePeriod
Price Return
Dividend Return
Total Return
3 Months
-9.98%
0%
-9.98%
6 Months
0%
0%
0.0%
1 Year
50.22%
0%
50.22%
2 Years
-27.28%
0%
-27.28%
3 Years
1.12%
0%
1.12%
4 Years
-23.28%
0%
-23.28%
5 Years
-58.09%
0%
-58.09%

Starcom Info. for the last several years.

Risk Adjusted Returns v/s stock-summary
Returns Beta
Icon
Beta has not been calculated since enough price history is not available
stock-summaryNews & Corporate Actions
Announcements stock-summary

Board Meeting Outcome for Outcome Of Board Meeting Held On 14.11.2026

14-Nov-2026 | Source : BSE

Outcome of Board Meeting held on 14.11.2026

Results_Financials_30.09.2026

14-Nov-2026 | Source : BSE

Results_Financials_30.09.2026

Board Meeting Intimation for Intimation Of Board Meeting

11-Nov-2026 | Source : BSE

Starcom Information Technology Ltdhas informed BSE that the meeting of the Board of Directors of the Company is scheduled on 14/11/2026 inter alia to consider and approve We wish to inform you pursuant to Regulation 29 and other applicable provisions of the Securities and Exchange Board of India (Listing Obligations and Disclosure Requirements) Regulations 2015 (Listing Regulations) that a meeting of the Board of Directors of the Company is scheduled to be held on Saturday November 14 2026 at the Corporate office of the Company at Brigade Champak Infantry Rd Shivaji Nagar Bengaluru Karnataka 560001 inter alia among other agendas to consider and approve the un-audited Financial Results of the Company for the Second Quarter ended 30th September 2026 along with the statement of Assets & Liabilities.

Corporate Actions stock-summary
stock-summary
BOARD MEETING

No Upcoming Board Meetings

stock-summary
DIVIDEND

No Dividend history available

stock-summary
SPLITS

No Splits history available

stock-summary
BONUS

No Bonus history available

stock-summary
RIGHTS

No Rights history available

stock-summaryKey Factors
Quality key factors stock-summary
Factor
Value
Sales Growth (5y)
-18.10%
EBIT Growth (5y)
-172.19%
EBIT to Interest (avg)
0
Debt to EBITDA (avg)
Negative Net Debt
Net Debt to Equity (avg)
-0.59
Sales to Capital Employed (avg)
0
Tax Ratio
Tax Ratio is Negative%
Dividend Payout Ratio
0
Pledged Shares
0
Institutional Holding
6.98%
ROCE (avg)
-7.63%
ROE (avg)
0
Valuation key factors
Factor
Value
P/E Ratio
NA (Loss Making)
Industry P/E
20
Price to Book Value
-1.25
EV to EBIT
-9.30
EV to EBITDA
-9.97
EV to Capital Employed
-4.44
EV to Sales
35.14
PEG Ratio
NA
Dividend Yield
NA
ROCE (Latest)
Negative Capital Employed
ROE (Latest)
Negative BV
Technicals key factors
Indicator
Weekly
Monthly
Icon
Technical indicator has not been calculated since the stock has been active for a short period
stock-summary Technical Indicator Scale: Bearish, Mildly Bearish, Sideways, Mildly Bullish, Bullish  Turned 
stock-summaryShareholding
Shareholding Snapshot : Sep 2026stock-summary
Shareholding Compare (%holding) stock-summary
Majority shareholders

Non Institution

Pledged Promoter Holdings

None

Mutual Funds

Held by 0 Schemes

FIIs

Held by 2 FIIs (6.98%)

Promoter with highest holding

Ziaulla Sheriff (45.17%)

Highest Public shareholder

Techuni Ventures Private Limited (21.69%)

Individual Investors Holdings

20.12%

stock-summaryFinancial
[
  {
    "link": "quarterly",
    "btn_text": "All Quarterly Results",
    "header": "Quarterly Results Snapshot (Standalone) - Sep'26 - YoY",
    "rhs": [
      {
        "prefix": "Net Sales ",
        "suffix": "YoY Growth in quarter ended Sep 2026 is 4.17% vs -37.66% in Sep 2025",
        "dir": 1
      },
      {
        "prefix": "Standalone Net Profit ",
        "suffix": "YoY Growth in quarter ended Sep 2026 is -31.67% vs -16.50% in Sep 2025",
        "dir": -1
      }
    ],
    "table": {
      "header": [
        "Sep'26",
        "Sep'25",
        "Change(%)"
      ],
      "body": [
        {
          "field": "Net Sales",
          "val1": "0.50",
          "val2": "0.48",
          "chgp": "4.17%",
          "chgp_class": "positive"
        },
        {
          "field": "Operating Profit (PBDIT) excl Other Income",
          "val1": "-1.36",
          "val2": "-1.05",
          "chgp": "-29.52%",
          "chgp_class": "negative"
        },
        {
          "field": "Interest",
          "val1": "0.15",
          "val2": "0.12",
          "chgp": "25.00%",
          "chgp_class": "negative"
        },
        {
          "field": "Exceptional Items",
          "val1": "0.00",
          "val2": "0.00",
          "chgp": "",
          "chgp_class": "neutral"
        },
        {
          "field": "Standalone Net Profit",
          "val1": "-1.58",
          "val2": "-1.20",
          "chgp": "-31.67%",
          "chgp_class": "negative"
        },
        {
          "field": "Operating Profit Margin (Excl OI)",
          "val1": "-272.00%",
          "val2": "-218.75%",
          "chgp": "-53.25%",
          "chgp_class": "negative"
        }
      ]
    }
  },
  {
    "link": "half-yearly",
    "btn_text": "All Half Yearly Results",
    "alert": "No Half Yearly Results declared by Starcom Info."
  },
  {
    "link": "nine-monthly",
    "btn_text": "All Nine Monthly Results",
    "alert": "No Nine Monthly Results declared by Starcom Info."
  },
  {
    "link": "annual",
    "btn_text": "All Annual Results",
    "header": "Annual Results Snapshot (Standalone) - Mar'26",
    "rhs": [
      {
        "prefix": "Net Sales ",
        "suffix": "YoY Growth in year ended Mar 2026 is -39.39% vs 65.00% in Mar 2025",
        "dir": -1
      },
      {
        "prefix": "Standalone Net Profit ",
        "suffix": "YoY Growth in year ended Mar 2026 is -24.00% vs 34.98% in Mar 2025",
        "dir": -1
      }
    ],
    "table": {
      "header": [
        "Mar'26",
        "Mar'25",
        "Change(%)"
      ],
      "body": [
        {
          "field": "Net Sales",
          "val1": "1.80",
          "val2": "2.97",
          "chgp": "-39.39%",
          "chgp_class": "negative"
        },
        {
          "field": "Operating Profit (PBDIT) excl Other Income",
          "val1": "-5.36",
          "val2": "-4.49",
          "chgp": "-19.38%",
          "chgp_class": "negative"
        },
        {
          "field": "Interest",
          "val1": "0.70",
          "val2": "0.41",
          "chgp": "70.73%",
          "chgp_class": "negative"
        },
        {
          "field": "Exceptional Items",
          "val1": "0.00",
          "val2": "0.00",
          "chgp": "",
          "chgp_class": "neutral"
        },
        {
          "field": "Standalone Net Profit",
          "val1": "-6.20",
          "val2": "-5.00",
          "chgp": "-24.00%",
          "chgp_class": "negative"
        },
        {
          "field": "Operating Profit Margin (Excl OI)",
          "val1": "-297.78%",
          "val2": "-151.18%",
          "chgp": "-146.60%",
          "chgp_class": "negative"
        }
      ]
    }
  }
]
Quarterly Results Snapshot (Standalone) - Sep'26 - YoYstock-summary
Sep'26
Sep'25
Change(%)
Net Sales
0.50
0.48
4.17%
Operating Profit (PBDIT) excl Other Income
-1.36
-1.05
-29.52%
Interest
0.15
0.12
25.00%
Exceptional Items
0.00
0.00
Standalone Net Profit
-1.58
-1.20
-31.67%
Operating Profit Margin (Excl OI)
-272.00%
-218.75%
-53.25%
Values in Rs Cr.
Direction Arrows
Net Sales

YoY Growth in quarter ended Sep 2026 is 4.17% vs -37.66% in Sep 2025

Direction Arrows
Standalone Net Profit

YoY Growth in quarter ended Sep 2026 is -31.67% vs -16.50% in Sep 2025

Annual Results Snapshot (Standalone) - Mar'26stock-summary
Mar'26
Mar'25
Change(%)
Net Sales
1.80
2.97
-39.39%
Operating Profit (PBDIT) excl Other Income
-5.36
-4.49
-19.38%
Interest
0.70
0.41
70.73%
Exceptional Items
0.00
0.00
Standalone Net Profit
-6.20
-5.00
-24.00%
Operating Profit Margin (Excl OI)
-297.78%
-151.18%
-146.60%
Values in Rs Cr.
Direction Arrows
Net Sales

YoY Growth in year ended Mar 2026 is -39.39% vs 65.00% in Mar 2025

Direction Arrows
Standalone Net Profit

YoY Growth in year ended Mar 2026 is -24.00% vs 34.98% in Mar 2025

stock-summaryCompany CV
About stock-summary
stock-summary
Company Coordinates stock-summary
Company Details
stock-summary
Tel:
stock-summary
stock-summary
Registrar Details