Sri Lotus

  • Market Cap: Small Cap
  • Industry: Realty
  • ISIN: INE0V9Q01010
  • NSEID: LOTUSDEV
  • BSEID: 544469
INR
234.90
1.25 (0.53%)
BSENSE

Nov 20

BSE+NSE Vol: 5.42 lacs

  • Price Points
  • Score
  • Mojo Parameters
  • Total Return
  • News and Corporate Actions
  • Key factors
  • Shareholding
  • Financials
  • CompanyCV
stock-summaryPrice Point
High/Low

1Day

52 Week

Valuation
Technical
Day's Volume

CASH

5.42 lacs (-51.55%) Volume

Shareholding (Sep 2026)

FII

4.18%

Held by 25 FIIs

DII

0.88%

Held by 4 DIIs

Promoter

79.87%

Is Sri Lotus overvalued or undervalued?

01-Sep-2025

As of August 29, 2025, Sri Lotus is considered very expensive and overvalued with a PE ratio of 38.94, an EV to EBITDA ratio of 29.75, and a ROE of 24.39%, underperforming the Sensex with a return of -5.72%.

As of 29 August 2025, the valuation grade for Sri Lotus has moved from does not qualify to very expensive. The company is currently overvalued based on its financial metrics. Key ratios include a PE ratio of 38.94, an EV to EBITDA ratio of 29.75, and a ROE of 24.39%. <BR><BR>In comparison to its peers, DLF has a PE ratio of 38.29 and Lodha Developers has a PE ratio of 40.42, both indicating that Sri Lotus is positioned at a premium within its competitive landscape. The stock has underperformed relative to the Sensex over the past week, with a return of -5.72% compared to the Sensex's -1.84%, further reinforcing the notion of overvaluation.

Read More

How has been the historical performance of Sri Lotus?

13-Nov-2025

Sri Lotus reported significant growth for the fiscal year ending March 2025, with net sales of 549.68 crore, a profit after tax of 227.89 crore, and an operating profit margin of 52.57%. The company maintained a balanced position with total assets and liabilities at 1,218.05 crore and a net cash inflow of 246 crore.

Answer:<BR>The historical performance of Sri Lotus shows significant growth in various financial metrics for the year ending March 2025.<BR><BR>Breakdown:<BR>In the fiscal year ending March 2025, Sri Lotus reported net sales of 549.68 crore, with total operating income matching this figure as there was no other operating income. The total expenditure, excluding depreciation, was 260.72 crore, leading to an operating profit (PBDIT) of 308.56 crore. After accounting for interest and depreciation, the profit before tax stood at 306.82 crore, resulting in a profit after tax of 227.89 crore. The consolidated net profit was recorded at 227.41 crore, with an earnings per share (EPS) of 5.22. The operating profit margin was notably high at 52.57%, and the profit after tax margin was 41.46%. On the balance sheet, total assets increased to 1,218.05 crore, with total liabilities also rising to 1,218.05 crore, indicating a balanced position. The company’s cash flow showed a net inflow of 246 crore, with closing cash and cash equivalents reaching 348 crore. Overall, Sri Lotus demonstrated robust financial health and growth in its operations during this period.

Read More

Which are the latest news on Sri Lotus?

03-Dec-2025

Why is Sri Lotus falling/rising?

04-Dec-2025

As of 03-Dec, the stock price of Sri Lotus Developers & Realty Ltd is declining, currently at Rs. 163.45, reflecting a 2.16% decrease. The stock has hit a new 52-week low and is underperforming its sector, indicating a bearish trend despite increased investor participation.

As of 03-Dec, the stock price of Sri Lotus Developers & Realty Ltd is falling, currently at Rs. 163.45, which reflects a decrease of Rs. 3.6 or 2.16%. This decline is evident in the stock's performance over various periods, with a 1-week drop of 3.65% and a 1-month decrease of 7.73%, while the benchmark Sensex has shown a modest increase of 1.34% over the same month. <BR><BR>Additionally, the stock hit a new 52-week low of Rs. 162.8 today, indicating significant downward pressure. It has underperformed its sector by 1.45% today and has been trading below its 5-day, 20-day, 50-day, 100-day, and 200-day moving averages, which suggests a bearish trend. Although there has been a notable increase in investor participation, with delivery volume rising by 109.2% against the 5-day average, the overall market sentiment appears negative, contributing to the stock's decline.

Read More
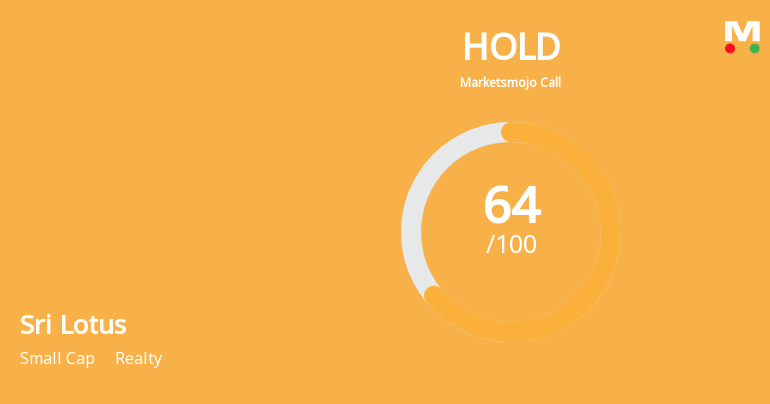
iScoreScore
Click here to find our call on this stock
Strong Sell
Sell
Hold
Buy
Strong Buy
Dashboard
1

Company has a low Debt to Equity ratio (avg) at 0 times

 
2

Positive results in Sep 26

3

Stock is technically in a Bullish range

4

With ROE of 14.4, it has a Very Expensive valuation with a 5.6 Price to Book Value

5

Reducing Promoter Confidence

6

Market Beating Performance

stock-summaryMojo Parameters
Mojo Parameters
Loading Valuation Snapshot...
Stock DNA
stock-summary
Industry

Realty

stock-summary
Market cap

INR 11,287 Cr (Small Cap)

stock-summary
P/E

39.00

stock-summary
Industry P/E

33

stock-summary
Dividend Yield

0.34%

stock-summary
Debt Equity

-0.25

stock-summary
Return on Equity

14.39%

stock-summary
Price to Book

5.60

Revenue and Profits:
Net Sales:
269 Cr
(Quarterly Results - Sep 2026)
Net Profit:
82 Cr
stock-summaryTotal Returns
Total Returns (Price + Dividend) stock-summary
Dividend Yield (0.34%)
TimePeriod
Price Return
Dividend Return
Total Return
3 Months
40.24%
0%
40.24%
6 Months
71.02%
0%
71.02%
1 Year
37.45%
0%
37.45%
2 Years
0%
0%
0.0%
3 Years
0%
0%
0.0%
4 Years
0%
0%
0.0%
5 Years
0%
0%
0.0%

Sri Lotus for the last several years.

Risk Adjusted Returns v/s stock-summary
Returns Beta
Icon
Beta has not been calculated since enough price history is not available
stock-summaryNews & Corporate Actions
News
Announcements stock-summary

Disclosures under Reg. 29(2) of SEBI (SAST) Regulations 2011

06-Nov-2026 | Source : BSE

The Exchange has received the disclosure under Regulation 29(2) of SEBI (Substantial Acquisition of Shares & Takeovers) Regulations 2011 for Anand Kamalnayan Pandit

Disclosures under Reg. 29(1) of SEBI (SAST) Regulations 2011

05-Nov-2026 | Source : BSE

The Exchange has received the disclosure under Regulation 29(1) of SEBI (Substantial Acquisition of Shares & Takeovers) Regulations 2011 for SMALLCAP World Fund Inc.

Updates on Notice of Offer for Sale of shares by Promoter (Oversubscription)

03-Nov-2026 | Source : BSE

With reference to the earlier announcement dated November 02 2026 regarding Notice of Offer for Sale of shares by Promoter & Floor Price Anand Kamalnayan Pandit (the "Promoter" or the "Seller) has informed BSE about his intention to exercise over-subscription option for 2704182 equity shares.

Corporate Actions stock-summary
stock-summary
BOARD MEETING

No Upcoming Board Meetings

stock-summary
DIVIDEND

Sri Lotus Developers & Realty Ltd has declared 50% dividend, ex-date: 25 Sep 26

stock-summary
SPLITS

No Splits history available

stock-summary
BONUS

No Bonus history available

stock-summary
RIGHTS

No Rights history available

stock-summaryKey Factors
Quality key factors stock-summary
Factor
Value
Sales Growth (5y)
39.90%
EBIT Growth (5y)
-2.96%
EBIT to Interest (avg)
100.00
Debt to EBITDA (avg)
0.47
Net Debt to Equity (avg)
-0.25
Sales to Capital Employed (avg)
0.34
Tax Ratio
25.23%
Dividend Payout Ratio
0
Pledged Shares
0.01%
Institutional Holding
5.06%
ROCE (avg)
24.88%
ROE (avg)
14.39%
Valuation key factors
Factor
Value
P/E Ratio
39
Industry P/E
33
Price to Book Value
5.62
EV to EBIT
30.83
EV to EBITDA
30.67
EV to Capital Employed
7.18
EV to Sales
11.71
PEG Ratio
NA
Dividend Yield
0.34%
ROCE (Latest)
23.30%
ROE (Latest)
14.39%
Technicals key factors
Indicator
Weekly
Monthly
MACD
Bullish
RSI
No Signal
Bearish
Bollinger Bands
Bullish
Moving Averages
Bullish (Daily)
KST
Bullish
Dow Theory
Mildly Bearish
Bullish
OBV
Bullish
Bullish
stock-summary Technical Indicator Scale: Bearish, Mildly Bearish, Sideways, Mildly Bullish, Bullish  Turned 
stock-summaryShareholding
Shareholding Snapshot : Sep 2026stock-summary
Shareholding Compare (%holding) stock-summary
Majority shareholders

Promoters

Pledged Promoter Holdings

0.0097

Mutual Funds

Held by 6 Schemes (0.22%)

FIIs

Held by 25 FIIs (4.18%)

Promoter with highest holding

Anand Kamalnayan Pandit (70.03%)

Highest Public shareholder

Smallcap World Fund, Inc (1.95%)

Individual Investors Holdings

10.06%

stock-summaryFinancial
[
  {
    "link": "quarterly",
    "btn_text": "All Quarterly Results",
    "header": "Quarterly Results Snapshot (Consolidated) - Sep'26 - QoQ",
    "rhs": [
      {
        "prefix": "Net Sales ",
        "suffix": "QoQ Growth in quarter ended Sep 2026 is 102.93% vs -56.96% in Jun 2026",
        "dir": 1
      },
      {
        "prefix": "Consolidated Net Profit ",
        "suffix": "QoQ Growth in quarter ended Sep 2026 is 80.58% vs -52.44% in Jun 2026",
        "dir": 1
      }
    ],
    "table": {
      "header": [
        "Sep'26",
        "Jun'26",
        "Change(%)"
      ],
      "body": [
        {
          "field": "Net Sales",
          "val1": "268.58",
          "val2": "132.35",
          "chgp": "102.93%",
          "chgp_class": "positive"
        },
        {
          "field": "Operating Profit (PBDIT) excl Other Income",
          "val1": "107.25",
          "val2": "48.14",
          "chgp": "122.79%",
          "chgp_class": "positive"
        },
        {
          "field": "Interest",
          "val1": "0.51",
          "val2": "0.51",
          "chgp": "",
          "chgp_class": "neutral"
        },
        {
          "field": "Exceptional Items",
          "val1": "0.00",
          "val2": "0.00",
          "chgp": "",
          "chgp_class": "neutral"
        },
        {
          "field": "Consolidate Net Profit",
          "val1": "82.09",
          "val2": "45.46",
          "chgp": "80.58%",
          "chgp_class": "positive"
        },
        {
          "field": "Operating Profit Margin (Excl OI)",
          "val1": "39.93%",
          "val2": "36.37%",
          "chgp": "3.56%",
          "chgp_class": "positive"
        }
      ]
    }
  },
  {
    "link": "half-yearly",
    "btn_text": "All Half Yearly Results",
    "header": "Half Yearly Results Snapshot (Standalone) - Sep'25",
    "rhs": [
      {
        "prefix": "Net Sales ",
        "suffix": "Not Applicable: The company has declared_date for only one period",
        "dir": 0
      },
      {
        "prefix": "Standalone Net Profit ",
        "suffix": "Not Applicable: The company has declared_date for only one period",
        "dir": 0
      }
    ],
    "table": {
      "header": [
        "Sep'25",
        "Sep'24",
        "Change(%)"
      ],
      "body": [
        {
          "field": "Net Sales",
          "val1": "75.26",
          "val2": "164.53",
          "chgp": "-54.26%",
          "chgp_class": "negative"
        },
        {
          "field": "Operating Profit (PBDIT) excl Other Income",
          "val1": "45.99",
          "val2": "102.69",
          "chgp": "-55.21%",
          "chgp_class": "negative"
        },
        {
          "field": "Interest",
          "val1": "0.05",
          "val2": "0.03",
          "chgp": "66.67%",
          "chgp_class": "negative"
        },
        {
          "field": "Exceptional Items",
          "val1": "0.00",
          "val2": "0.00",
          "chgp": "",
          "chgp_class": "neutral"
        },
        {
          "field": "Standalone Net Profit",
          "val1": "45.67",
          "val2": "77.30",
          "chgp": "-40.92%",
          "chgp_class": "negative"
        },
        {
          "field": "Operating Profit Margin (Excl OI)",
          "val1": "61.11%",
          "val2": "62.41%",
          "chgp": "-1.30%",
          "chgp_class": "negative"
        }
      ]
    }
  },
  {
    "link": "nine-monthly",
    "btn_text": "All Nine Monthly Results",
    "header": "Nine Monthly Results Snapshot (Standalone) - Dec'25",
    "rhs": [
      {
        "prefix": "Net Sales ",
        "suffix": "Not Applicable: The company has declared_date for only one period",
        "dir": 0
      },
      {
        "prefix": "Standalone Net Profit ",
        "suffix": "Not Applicable: The company has declared_date for only one period",
        "dir": 0
      }
    ],
    "table": {
      "header": [
        "Dec'25",
        "Dec'24",
        "Change(%)"
      ],
      "body": [
        {
          "field": "Net Sales",
          "val1": "105.26",
          "val2": "244.80",
          "chgp": "-57.00%",
          "chgp_class": "negative"
        },
        {
          "field": "Operating Profit (PBDIT) excl Other Income",
          "val1": "69.12",
          "val2": "155.57",
          "chgp": "-55.57%",
          "chgp_class": "negative"
        },
        {
          "field": "Interest",
          "val1": "0.07",
          "val2": "0.04",
          "chgp": "75.00%",
          "chgp_class": "negative"
        },
        {
          "field": "Exceptional Items",
          "val1": "0.00",
          "val2": "0.00",
          "chgp": "",
          "chgp_class": "neutral"
        },
        {
          "field": "Standalone Net Profit",
          "val1": "72.63",
          "val2": "121.24",
          "chgp": "-40.09%",
          "chgp_class": "negative"
        },
        {
          "field": "Operating Profit Margin (Excl OI)",
          "val1": "65.67%",
          "val2": "63.55%",
          "chgp": "2.12%",
          "chgp_class": "positive"
        }
      ]
    }
  },
  {
    "link": "annual",
    "btn_text": "All Annual Results",
    "header": "Annual Results Snapshot (Standalone) - Mar'26",
    "rhs": [
      {
        "prefix": "Net Sales ",
        "suffix": "Not Applicable: The company has declared_date for only one period",
        "dir": 0
      },
      {
        "prefix": "Standalone Net Profit ",
        "suffix": "Not Applicable: The company has declared_date for only one period",
        "dir": 0
      }
    ],
    "table": {
      "header": [
        "Mar'26",
        "Mar'25",
        "Change(%)"
      ],
      "body": [
        {
          "field": "Net Sales",
          "val1": "142.76",
          "val2": "387.22",
          "chgp": "-63.13%",
          "chgp_class": "negative"
        },
        {
          "field": "Operating Profit (PBDIT) excl Other Income",
          "val1": "95.02",
          "val2": "250.44",
          "chgp": "-62.06%",
          "chgp_class": "negative"
        },
        {
          "field": "Interest",
          "val1": "0.08",
          "val2": "0.07",
          "chgp": "14.29%",
          "chgp_class": "negative"
        },
        {
          "field": "Exceptional Items",
          "val1": "0.00",
          "val2": "0.00",
          "chgp": "",
          "chgp_class": "neutral"
        },
        {
          "field": "Standalone Net Profit",
          "val1": "100.49",
          "val2": "196.14",
          "chgp": "-48.77%",
          "chgp_class": "negative"
        },
        {
          "field": "Operating Profit Margin (Excl OI)",
          "val1": "66.56%",
          "val2": "64.68%",
          "chgp": "1.88%",
          "chgp_class": "positive"
        }
      ]
    }
  }
]
Quarterly Results Snapshot (Consolidated) - Sep'26 - QoQstock-summary
Sep'26
Jun'26
Change(%)
Net Sales
268.58
132.35
102.93%
Operating Profit (PBDIT) excl Other Income
107.25
48.14
122.79%
Interest
0.51
0.51
Exceptional Items
0.00
0.00
Consolidate Net Profit
82.09
45.46
80.58%
Operating Profit Margin (Excl OI)
39.93%
36.37%
3.56%
Values in Rs Cr.
Direction Arrows
Net Sales

QoQ Growth in quarter ended Sep 2026 is 102.93% vs -56.96% in Jun 2026

Direction Arrows
Consolidated Net Profit

QoQ Growth in quarter ended Sep 2026 is 80.58% vs -52.44% in Jun 2026

Half Yearly Results Snapshot (Standalone) - Sep'25stock-summary
Sep'25
Sep'24
Change(%)
Net Sales
75.26
164.53
-54.26%
Operating Profit (PBDIT) excl Other Income
45.99
102.69
-55.21%
Interest
0.05
0.03
66.67%
Exceptional Items
0.00
0.00
Standalone Net Profit
45.67
77.30
-40.92%
Operating Profit Margin (Excl OI)
61.11%
62.41%
-1.30%
Values in Rs Cr.
Net Sales

Not Applicable: The company has declared_date for only one period

Standalone Net Profit

Not Applicable: The company has declared_date for only one period

Nine Monthly Results Snapshot (Standalone) - Dec'25stock-summary
Dec'25
Dec'24
Change(%)
Net Sales
105.26
244.80
-57.00%
Operating Profit (PBDIT) excl Other Income
69.12
155.57
-55.57%
Interest
0.07
0.04
75.00%
Exceptional Items
0.00
0.00
Standalone Net Profit
72.63
121.24
-40.09%
Operating Profit Margin (Excl OI)
65.67%
63.55%
2.12%
Values in Rs Cr.
Net Sales

Not Applicable: The company has declared_date for only one period

Standalone Net Profit

Not Applicable: The company has declared_date for only one period

Annual Results Snapshot (Standalone) - Mar'26stock-summary
Mar'26
Mar'25
Change(%)
Net Sales
142.76
387.22
-63.13%
Operating Profit (PBDIT) excl Other Income
95.02
250.44
-62.06%
Interest
0.08
0.07
14.29%
Exceptional Items
0.00
0.00
Standalone Net Profit
100.49
196.14
-48.77%
Operating Profit Margin (Excl OI)
66.56%
64.68%
1.88%
Values in Rs Cr.
Net Sales

Not Applicable: The company has declared_date for only one period

Standalone Net Profit

Not Applicable: The company has declared_date for only one period

stock-summaryCompany CV
About Sri Lotus Developers & Realty Ltd stock-summary
stock-summary
Sri Lotus Developers & Realty Ltd
Small Cap
Realty
Sri Lotus Developers & Realty Limited was incorporated as "AKP Holdings Private Limited", pursuant to Certificate of incorporation issued by the Registrar of Companies, at Mumbai on February 17, 2015. Subsequently, the name of the Company was changed to "AKP Holdings Limited", upon conversion into a Public Company, on December 05, 2024.
Company Coordinates stock-summary
Icon
No Company Details Available