
 Score
Dashboard
With a Operating Losses, the company has a Weak Long Term Fundamental Strength
- The company has been able to generate a Return on Equity (avg) of 6.96% signifying low profitability per unit of shareholders funds
Flat results in Sep 26
Stock is technically in a Bearish range
Risky - Negative EBITDA
Consistent Underperformance against the benchmark over the last 3 years
Mojo ParametersStock DNA

Garments & Apparels

INR 77 Cr (Micro Cap)

11.00
24

0.00%

-0.38

3.32%

0.36
Total ReturnsTotal Returns (Price + Dividend) 
Latest dividend: 1.0000 per share ex-dividend date: Sep-14-2007
Risk Adjusted Returns v/s
Returns Beta
 News & Corporate Actions
News
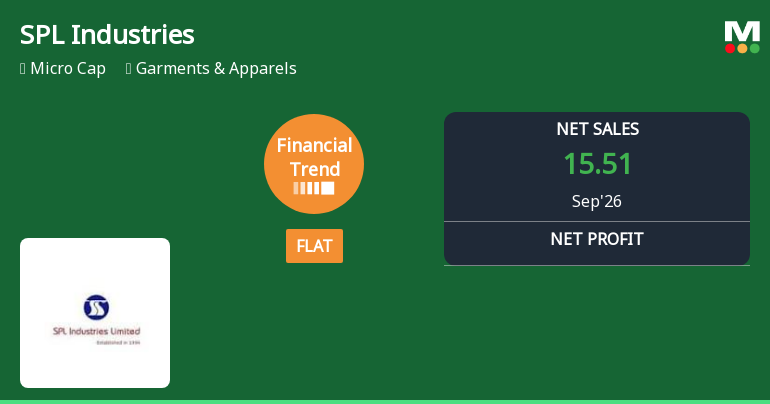
SPL Industries Ltd Reports Flat Quarterly Performance Amid Margin Pressures
SPL Industries Ltd, a micro-cap player in the Garments & Apparels sector, has reported a marked shift in its financial trend, moving from positive growth to a flat performance in the quarter ended September 2026. Despite a robust 38.9% growth in profit after tax (PAT) over nine months, the company’s quarterly results reveal significant margin contraction and operational challenges, prompting a downgrade to a Strong Sell rating by MarketsMojo.
Read More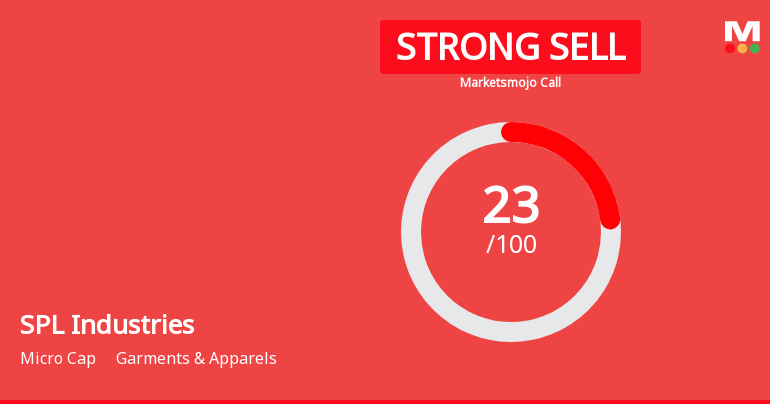
SPL Industries Ltd is Rated Strong Sell
SPL Industries Ltd is rated Strong Sell by MarketsMOJO, with this rating last updated on 05 October 2026. However, the analysis and financial metrics presented here reflect the stock's current position as of 01 November 2026, providing investors with an up-to-date view of the company’s fundamentals, valuation, financial trends, and technical outlook.
Read More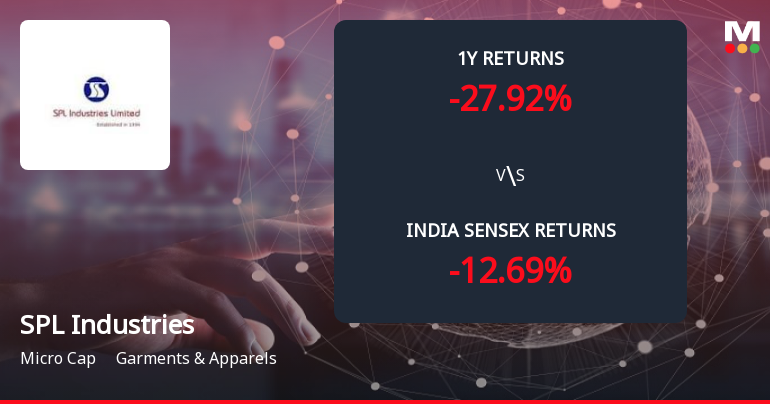
SPL Industries Ltd Forms Death Cross, Signalling Potential Bearish Trend
SPL Industries Ltd has recently formed a Death Cross, a significant technical indicator where the 50-day moving average crosses below the 200-day moving average. This development signals a potential deterioration in the stock’s trend and raises concerns about long-term weakness amid a challenging market environment for the Garments & Apparels sector.
Read More Announcements
Compliance U/R 47 Of SEBI (LODR) Regulation 2015
14-Nov-2026 | Source : BSEPursuant to Regulation 47 of SEBI (Listing Obligations and Disclosure Requirements) Regulation 2015 please find enclosed the extract of the newspaper advertisements published for dissemination of financial results for the period ended 30th September 2026
Board Meeting Outcome for Outcome Of The Board Meeting Held On Friday 13Th November 2026
13-Nov-2026 | Source : BSEThis is to inform you that the Board of Directors in their meeting held on today i.e. on Friday 13th November 2026 inter-alia considered the following matters-
Board Meeting Outcome for Outcome Of The Board Meeting Held On Friday 13Th November 2026
13-Nov-2026 | Source : BSEThis is to inform you that the Board of Directors in their meeting held on today i.e. on Friday 13th November 2026 inter-alia considered the following matters-
Corporate Actions

No Upcoming Board Meetings

SPL Industries Ltd has declared 10% dividend, ex-date: 14 Sep 07

No Splits history available

No Bonus history available

No Rights history available
Key FactorsQuality key factors
Valuation key factors
Technicals key factors
 Technical Indicator Scale: Bearish, Mildly Bearish, Sideways, Mildly Bullish, Bullish Turned Shareholding
Shareholding Snapshot : Sep 2026
Shareholding Compare (%holding)
Promoters
None
Held by 0 Schemes
Held by 1 FIIs (0.13%)
Kiran Aggarwal (20.08%)
None
22.28%
FinancialQuarterly Results Snapshot (Standalone) - Sep'26 - YoY
 Compare with Peers

YoY Growth in quarter ended Sep 2026 is 3.61% vs -62.09% in Sep 2025

YoY Growth in quarter ended Sep 2026 is -410.00% vs -105.04% in Sep 2025

Half Yearly Results Snapshot (Standalone) - Sep'25
Growth in half year ended Sep 2025 is -61.43% vs -17.54% in Sep 2024
Growth in half year ended Sep 2025 is -89.16% vs 15.93% in Sep 2024
Nine Monthly Results Snapshot (Standalone) - Dec'25
YoY Growth in nine months ended Dec 2025 is -57.44% vs -16.78% in Dec 2024
YoY Growth in nine months ended Dec 2025 is -54.89% vs -8.79% in Dec 2024
Annual Results Snapshot (Standalone) - Mar'26
YoY Growth in year ended Mar 2026 is -50.12% vs -30.03% in Mar 2025
YoY Growth in year ended Mar 2026 is -27.89% vs -16.68% in Mar 2025
 Company CV
About SPL Industries Ltd

Company Coordinates


