
 Score
Dashboard
With a Negative Book Value, the company has a Weak Long Term Fundamental Strength
- Poor long term growth as Net Sales has grown by an annual rate of -0.40% and Operating profit at 0% over the last 5 years
- High Debt Company with a Debt to Equity ratio (avg) at 0 times
Flat results in Sep 26
Risky - Negative EBITDA
Mojo ParametersStock DNA

Electronics & Appliances

INR 351 Cr (Micro Cap)

NA (Loss Making)
NA

0.00%

-0.97

13.27%

-2.33
Total ReturnsTotal Returns (Price + Dividend) 
Smaart Tech Serv for the last several years.
Risk Adjusted Returns v/s
Returns Beta
 News & Corporate Actions
News
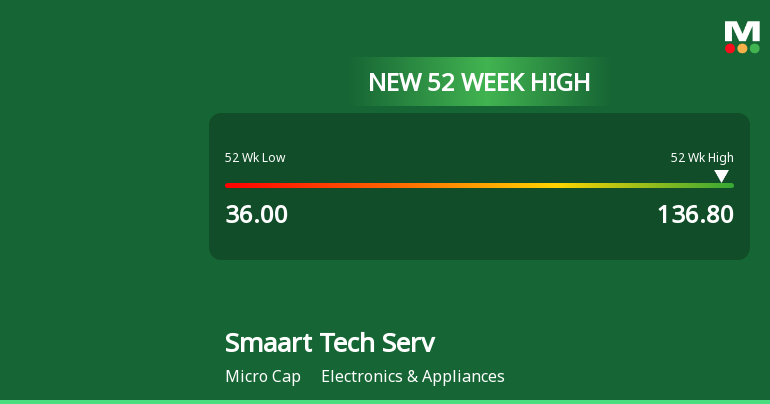
Broad-Based Technical Strength Lifts Smaart Tech Services Ltd to 52-Week High of Rs 136.8
From a 52-week low of Rs 36 to a new peak of Rs 136.8 on 09 Nov 2026, Smaart Tech Services Ltd has surged an impressive 267.8% over the past year, vastly outperforming the Sensex’s decline of 2.54%. This remarkable rally is underpinned by a confluence of technical indicators signalling sustained momentum across multiple timeframes.
Read More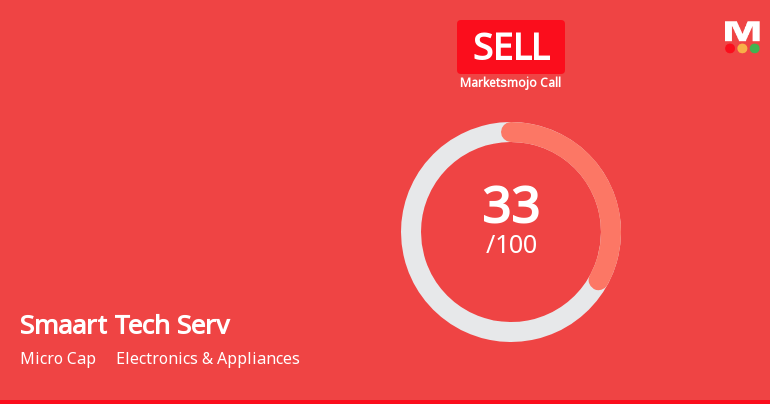
Smaart Tech Services Ltd is Rated Sell by MarketsMOJO
Smaart Tech Services Ltd is rated 'Sell' by MarketsMOJO, with this rating last updated on 28 April 2026. However, the analysis and financial metrics discussed here reflect the stock's current position as of 06 November 2026, providing investors with the latest insights into the company’s performance and outlook.
Read More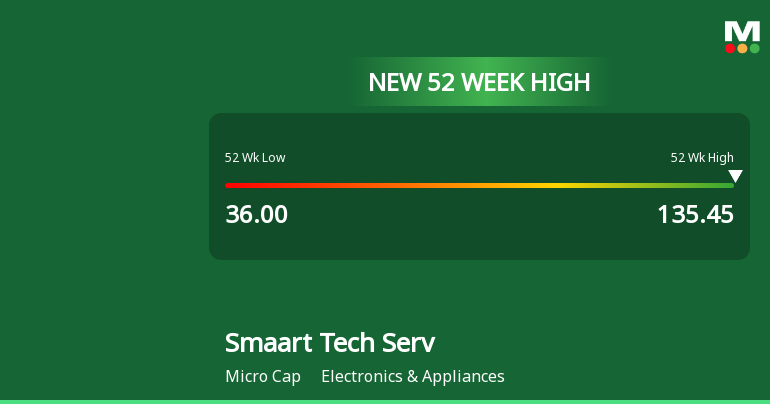
Broad-Based Technical Strength Lifts Smaart Tech Services Ltd to 52-Week High of Rs 135.45
Surging from a 52-week low of Rs 36 to a fresh peak of Rs 135.45 on 2 Nov 2026, Smaart Tech Services Ltd has delivered an extraordinary 160.48% rally over the past year, vastly outperforming the Sensex’s decline of 10.09%. This milestone reflects a powerful alignment of technical indicators and sustained price momentum that has propelled the stock well beyond its historical trading range.
Read More Announcements
Announcement under Regulation 30 (LODR)-Newspaper Publication
06-Nov-2026 | Source : BSENewspaper Publication of Unaudited Financial Results for quarter and half year ended September 30 2026.
Un Audited Financial Results For Quarter And Half Year Ended September 30 2026
05-Nov-2026 | Source : BSEUn audited Financial results for quarter and half year ended September 30 2026
Board Meeting Outcome for Financial Result For Quarter And Half Year Ended September 30 2026
05-Nov-2026 | Source : BSEFinancial Results for quarter and half year ended September 30 2026
Corporate Actions

No Upcoming Board Meetings

No Dividend history available

No Splits history available

No Bonus history available

No Rights history available
Key FactorsQuality key factors
Valuation key factors
Technicals key factors
 Technical Indicator Scale: Bearish, Mildly Bearish, Sideways, Mildly Bullish, Bullish Turned Shareholding
Shareholding Snapshot : Sep 2026
Shareholding Compare (%holding)
Promoters
None
Held by 2 Schemes (0.01%)
Held by 2 FIIs (0.0%)
Smart Services Private Limited (75.0%)
Guttikonda Rajasekhar (1.38%)
21.99%
FinancialQuarterly Results Snapshot (Standalone) - Sep'26 - YoY
 Compare with Peers
YoY Growth in quarter ended Sep 2026 is 0.00% vs 0.00% in Sep 2025

YoY Growth in quarter ended Sep 2026 is 66.94% vs -55.32% in Sep 2025

Half Yearly Results Snapshot (Standalone) - Sep'25
Growth in half year ended Sep 2025 is 0.00% vs -100.00% in Sep 2024

Growth in half year ended Sep 2025 is -30.94% vs -25.39% in Sep 2024
Nine Monthly Results Snapshot (Standalone) - Dec'25
YoY Growth in nine months ended Dec 2025 is 0.00% vs -100.00% in Dec 2024
YoY Growth in nine months ended Dec 2025 is -25.75% vs -25.60% in Dec 2024
Annual Results Snapshot (Standalone) - Mar'26
YoY Growth in year ended Mar 2026 is 0.00% vs 0.00% in Mar 2025
YoY Growth in year ended Mar 2026 is -25.45% vs -8.07% in Mar 2025
 Company CV
About Smaart Tech Services Ltd

Company Coordinates


