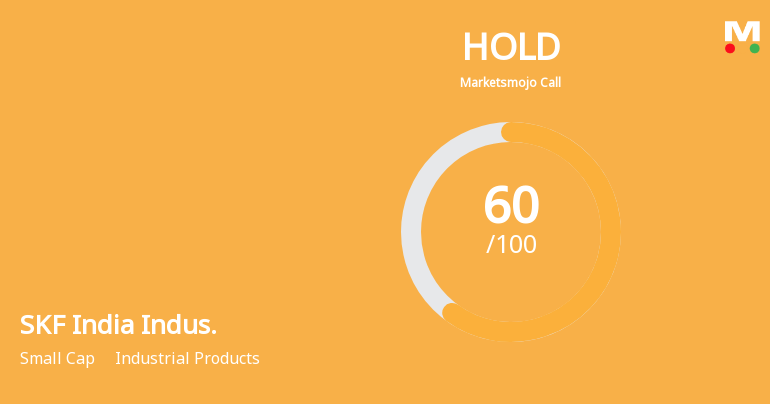
SKF India Indus.

  • Market Cap: Small Cap
  • Industry: Industrial Products
  • ISIN: INE2J8701016
  • NSEID: SKFINDUS
  • BSEID: 544572
INR
2,471.00
-39.4 (-1.57%)
BSENSE

Nov 20

BSE+NSE Vol: 14.93 k

  • Price Points
  • Score
  • Mojo Parameters
  • Total Return
  • News and Corporate Actions
  • Key factors
  • Shareholding
  • Financials
  • CompanyCV
stock-summaryPrice Point
High/Low

1Day

52 Week

Valuation
Technical
Day's Volume

CASH

14.93 k (-41.48%) Volume

Shareholding (Sep 2026)

FII

7.42%

Held by 118 FIIs

DII

26.74%

Held by 33 DIIs

Promoter

52.58%

iScoreScore
Click here to find our call on this stock
Strong Sell
Sell
Hold
Buy
Strong Buy
Dashboard
1

Flat results in Sep 26

  • NON-OPERATING INCOME(Q) is 33.55 % of Profit Before Tax (PBT)
2

With ROE of 27.8, it has a Expensive valuation with a 8.3 Price to Book Value

 
3

High Institutional Holdings at 34.15%

stock-summaryMojo Parameters
Mojo Parameters
Loading Valuation Snapshot...
Stock DNA
stock-summary
Industry

Industrial Products

stock-summary
Market cap

INR 12,353 Cr (Small Cap)

stock-summary
P/E

30.00

stock-summary
Industry P/E

38

stock-summary
Dividend Yield

1.19%

stock-summary
Debt Equity

-0.38

stock-summary
Return on Equity

27.80%

stock-summary
Price to Book

8.41

Revenue and Profits:
Net Sales:
1,043 Cr
(Quarterly Results - Sep 2026)
Net Profit:
103 Cr
stock-summaryTotal Returns
Total Returns (Price + Dividend) stock-summary
Dividend Yield (1.19%)
TimePeriod
Price Return
Dividend Return
Total Return
3 Months
-10.33%
0%
-10.33%
6 Months
19.84%
0%
19.84%
1 Year
0%
0%
0.0%
2 Years
0%
0%
0.0%
3 Years
0%
0%
0.0%
4 Years
0%
0%
0.0%
5 Years
0%
0%
0.0%

SKF India Indus. for the last several years.

Risk Adjusted Returns v/s stock-summary
Returns Beta
Icon
Beta has not been calculated since enough price history is not available
stock-summaryNews & Corporate Actions
Announcements stock-summary

Announcement under Regulation 30 (LODR)-Earnings Call Transcript

17-Nov-2026 | Source : BSE

Please find enclosed transcript of earnings call held on Thursday 12th November 2026 at 2pm.

Announcement under Regulation 30 (LODR)-Investor Presentation

12-Nov-2026 | Source : BSE

We are hereby submitting the presentation of earnings call on financial results for the second quarter ended 30th September 2026 scheduled on 12th November 2026 at 14:00 Hrs IST

Announcement under Regulation 30 (LODR)-Analyst / Investor Meet - Outcome

12-Nov-2026 | Source : BSE

Pursuant to Regulation 30 of SEBI LODR we are hereby submitting the audio recording of the Analyst/Institutional Investor Meeting held on Thursday 12th November 2026 at 2:00pm (IST) for Financial Results for the second quarter ended 30th September 2026.

Corporate Actions stock-summary
stock-summary
BOARD MEETING

No Upcoming Board Meetings

stock-summary
DIVIDEND

SKF India (Industrial) Ltd has declared 200% dividend, ex-date: 17 Aug 26

stock-summary
SPLITS

No Splits history available

stock-summary
BONUS

No Bonus history available

stock-summary
RIGHTS

No Rights history available

stock-summaryKey Factors
Quality key factors stock-summary
Factor
Value
Sales Growth (5y)
377.40%
EBIT Growth (5y)
136.02%
EBIT to Interest (avg)
100.00
Debt to EBITDA (avg)
Net Debt is too low
Net Debt to Equity (avg)
-0.38
Sales to Capital Employed (avg)
1.44
Tax Ratio
1.63%
Dividend Payout Ratio
22.71%
Pledged Shares
0
Institutional Holding
34.15%
ROCE (avg)
28.48%
ROE (avg)
18.53%
Valuation key factors
Factor
Value
P/E Ratio
30
Industry P/E
38
Price to Book Value
8.31
EV to EBIT
32.65
EV to EBITDA
30.02
EV to Capital Employed
12.83
EV to Sales
3.40
PEG Ratio
NA
Dividend Yield
1.21%
ROCE (Latest)
39.29%
ROE (Latest)
27.80%
Technicals key factors
Indicator
Weekly
Monthly
MACD
Bearish
RSI
No Signal
Bollinger Bands
Bearish
Moving Averages
Mildly Bullish (Daily)
KST
Bearish
Dow Theory
No Trend
No Trend
OBV
No Trend
Bullish
stock-summary Technical Indicator Scale: Bearish, Mildly Bearish, Sideways, Mildly Bullish, Bullish  Turned 
stock-summaryShareholding
Shareholding Snapshot : Sep 2026stock-summary
Shareholding Compare (%holding) stock-summary
Majority shareholders

Promoters

Pledged Promoter Holdings

None

Mutual Funds

Held by 15 Schemes (24.57%)

FIIs

Held by 118 FIIs (7.42%)

Promoter with highest holding

Ab Skf (52.58%)

Highest Public shareholder

Hdfc Mutual Fund - Hdfc Mid-cap Fund (9.67%)

Individual Investors Holdings

9.12%

stock-summaryFinancial
[
  {
    "link": "quarterly",
    "btn_text": "All Quarterly Results",
    "header": "Quarterly Results Snapshot (Standalone) - Sep'26 - QoQ",
    "rhs": [
      {
        "prefix": "Net Sales ",
        "suffix": "QoQ Growth in quarter ended Sep 2026 is 7.43% vs 2.65% in Jun 2026",
        "dir": 1
      },
      {
        "prefix": "Standalone Net Profit ",
        "suffix": "QoQ Growth in quarter ended Sep 2026 is 67.12% vs -47.95% in Jun 2026",
        "dir": 1
      }
    ],
    "table": {
      "header": [
        "Sep'26",
        "Jun'26",
        "Change(%)"
      ],
      "body": [
        {
          "field": "Net Sales",
          "val1": "1,042.86",
          "val2": "970.77",
          "chgp": "7.43%",
          "chgp_class": "positive"
        },
        {
          "field": "Operating Profit (PBDIT) excl Other Income",
          "val1": "100.51",
          "val2": "88.21",
          "chgp": "13.94%",
          "chgp_class": "positive"
        },
        {
          "field": "Interest",
          "val1": "0.62",
          "val2": "0.56",
          "chgp": "10.71%",
          "chgp_class": "negative"
        },
        {
          "field": "Exceptional Items",
          "val1": "0.00",
          "val2": "0.00",
          "chgp": "",
          "chgp_class": "neutral"
        },
        {
          "field": "Standalone Net Profit",
          "val1": "103.48",
          "val2": "61.92",
          "chgp": "67.12%",
          "chgp_class": "positive"
        },
        {
          "field": "Operating Profit Margin (Excl OI)",
          "val1": "9.64%",
          "val2": "9.09%",
          "chgp": "0.55%",
          "chgp_class": "positive"
        }
      ]
    }
  },
  {
    "link": "half-yearly",
    "btn_text": "All Half Yearly Results",
    "alert": "No Half Yearly Results declared by SKF India Indus."
  },
  {
    "link": "nine-monthly",
    "btn_text": "All Nine Monthly Results",
    "alert": "No Nine Monthly Results declared by SKF India Indus."
  },
  {
    "link": "annual",
    "btn_text": "All Annual Results",
    "header": "Annual Results Snapshot (Standalone) - Mar'26",
    "rhs": [
      {
        "prefix": "Net Sales ",
        "suffix": "Not Applicable: The company has declared_date for only one period",
        "dir": 0
      },
      {
        "prefix": "Standalone Net Profit ",
        "suffix": "Not Applicable: The company has declared_date for only one period",
        "dir": 0
      }
    ],
    "table": {
      "header": [
        "Mar'26",
        "Mar'25",
        "Change(%)"
      ],
      "body": [
        {
          "field": "Net Sales",
          "val1": "3,440.36",
          "val2": "720.61",
          "chgp": "377.42%",
          "chgp_class": "positive"
        },
        {
          "field": "Operating Profit (PBDIT) excl Other Income",
          "val1": "389.84",
          "val2": "161.15",
          "chgp": "141.91%",
          "chgp_class": "positive"
        },
        {
          "field": "Interest",
          "val1": "0.21",
          "val2": "0.14",
          "chgp": "50.00%",
          "chgp_class": "negative"
        },
        {
          "field": "Exceptional Items",
          "val1": "-196.10",
          "val2": "0.00",
          "chgp": "",
          "chgp_class": "neutral"
        },
        {
          "field": "Standalone Net Profit",
          "val1": "217.67",
          "val2": "121.31",
          "chgp": "79.43%",
          "chgp_class": "positive"
        },
        {
          "field": "Operating Profit Margin (Excl OI)",
          "val1": "11.33%",
          "val2": "22.36%",
          "chgp": "-11.03%",
          "chgp_class": "negative"
        }
      ]
    }
  }
]
Quarterly Results Snapshot (Standalone) - Sep'26 - QoQstock-summary
Sep'26
Jun'26
Change(%)
Net Sales
1,042.86
970.77
7.43%
Operating Profit (PBDIT) excl Other Income
100.51
88.21
13.94%
Interest
0.62
0.56
10.71%
Exceptional Items
0.00
0.00
Standalone Net Profit
103.48
61.92
67.12%
Operating Profit Margin (Excl OI)
9.64%
9.09%
0.55%
Values in Rs Cr.
Direction Arrows
Net Sales

QoQ Growth in quarter ended Sep 2026 is 7.43% vs 2.65% in Jun 2026

Direction Arrows
Standalone Net Profit

QoQ Growth in quarter ended Sep 2026 is 67.12% vs -47.95% in Jun 2026

Annual Results Snapshot (Standalone) - Mar'26stock-summary
Mar'26
Mar'25
Change(%)
Net Sales
3,440.36
720.61
377.42%
Operating Profit (PBDIT) excl Other Income
389.84
161.15
141.91%
Interest
0.21
0.14
50.00%
Exceptional Items
-196.10
0.00
Standalone Net Profit
217.67
121.31
79.43%
Operating Profit Margin (Excl OI)
11.33%
22.36%
-11.03%
Values in Rs Cr.
Net Sales

Not Applicable: The company has declared_date for only one period

Standalone Net Profit

Not Applicable: The company has declared_date for only one period

stock-summaryCompany CV
About stock-summary
stock-summary
Company Coordinates stock-summary
Company Details
stock-summary
Tel:
stock-summary
stock-summary
Registrar Details