
 Mojo Parameters
Stock DNA

Garments & Apparels

INR 28 Cr (Micro Cap)

147.00
52

0.00%

0.00

0.52%

0.81
Total ReturnsTotal Returns (Price + Dividend) 
Sanblue Corp. for the last several years.
Risk Adjusted Returns v/s
Returns Beta
 News & Corporate Actions
News
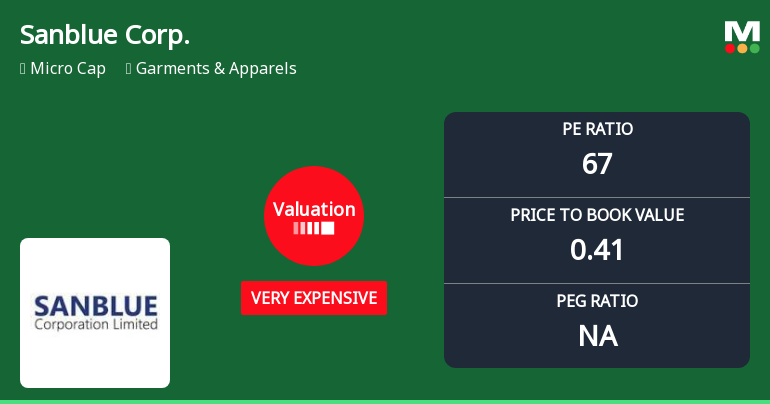
Sanblue Corporation Ltd Valuation Shifts Signal Heightened Price Risk
Sanblue Corporation Ltd, a micro-cap player in the Garments & Apparels sector, has seen a marked deterioration in its valuation attractiveness as key multiples surge beyond historical and peer averages. The company’s price-to-earnings (P/E) ratio now stands at 66.54, categorising it as very expensive, a significant shift from its previous expensive rating. This article analyses the implications of these valuation changes, contrasting them with sector peers and broader market benchmarks to provide a comprehensive view for investors.
Read More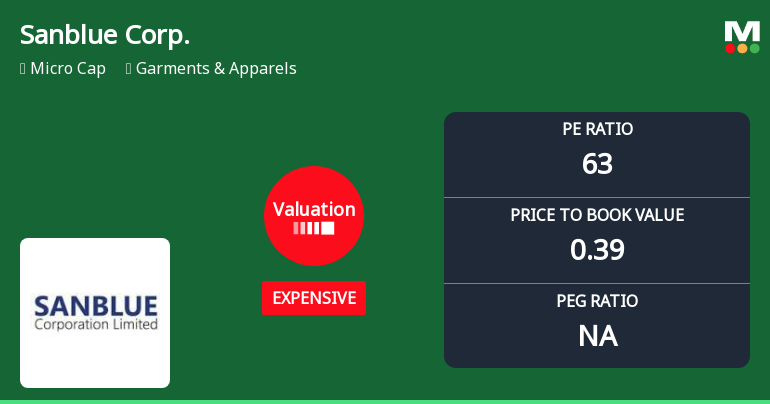
Sanblue Corporation Ltd Valuation Shifts Signal Heightened Price Risk
Sanblue Corporation Ltd, a micro-cap player in the Garments & Apparels sector, has experienced a notable shift in its valuation parameters, moving from a very expensive to an expensive rating. This change, coupled with a recent downgrade in its Mojo Grade to Strong Sell, highlights evolving market perceptions and raises questions about its price attractiveness relative to peers and historical benchmarks.
Read More Announcements
Announcement under Regulation 30 (LODR)-Newspaper Publication
10-Nov-2026 | Source : BSEPUBLICATION OF FINANCIAL RESULTS FOR THE QUARTER ENDED 30/09/2026
QUARTERLY UNAUDITED STANDALONE FINANCIAL RESULTS FOR THE QUARTER ENDED 30/09/2026
06-Nov-2026 | Source : BSEThe Board has considered and adopted Standlone unaudited quarterly financial results for the quarter ended 30/09/2026 alongwith limited review report.
Board Meeting Outcome for OUTCOME OF THE BOARD MEETING FOR THE QUARTER ENDED 30.09.2026
06-Nov-2026 | Source : BSEWe are pleased to submit the outcome of the meeting of the Board of Directors of the
Corporate Actions

No Upcoming Board Meetings

No Dividend history available

No Splits history available

No Bonus history available

No Rights history available
Key FactorsQuality key factors
Valuation key factors
Technicals key factors
 Technical Indicator Scale: Bearish, Mildly Bearish, Sideways, Mildly Bullish, Bullish Turned Shareholding
Shareholding Snapshot : Sep 2026
Shareholding Compare (%holding)
Promoters
None
Held by 0 Schemes
Held by 0 FIIs
Sanjiv Shah (59.65%)
Nitin K Patel (7.2%)
29.52%
FinancialQuarterly Results Snapshot (Standalone) - Sep'26 - QoQ
 Compare with Peers

QoQ Growth in quarter ended Sep 2026 is 24.68% vs 79.07% in Jun 2026

QoQ Growth in quarter ended Sep 2026 is 420.00% vs 28.57% in Jun 2026

Half Yearly Results Snapshot (Standalone) - Sep'25
Growth in half year ended Sep 2025 is 0.00% vs 0.00% in Sep 2024
Growth in half year ended Sep 2025 is -36.84% vs 11.76% in Sep 2024
Nine Monthly Results Snapshot (Standalone) - Dec'25
YoY Growth in nine months ended Dec 2025 is 0.00% vs 0.00% in Dec 2024
YoY Growth in nine months ended Dec 2025 is -25.71% vs 25.00% in Dec 2024
Annual Results Snapshot (Standalone) - Mar'26
YoY Growth in year ended Mar 2026 is 91.02% vs 19.29% in Mar 2025
YoY Growth in year ended Mar 2026 is -42.42% vs 32.00% in Mar 2025
 Company CV
About Sanblue Corporation Ltd

Company Coordinates


