
 Score
Dashboard
High Debt Company with a Debt to Equity ratio (avg) at 14.62 times
- High Debt Company with a Debt to Equity ratio (avg) at 14.62 times
- The company has been able to generate a Return on Equity (avg) of 5.52% signifying low profitability per unit of shareholders funds
Healthy long term growth as Net Sales has grown by an annual rate of 32.99%
With a growth in Net Sales of 40.1%, the company declared Very Positive results in Sep 26
Stock is technically in a Mildly Bearish range
With ROCE of 8.1, it has a Attractive valuation with a 1.5 Enterprise value to Capital Employed
Mojo ParametersStock DNA

Industrial Products

INR 121 Cr (Micro Cap)

14.00
20

0.00%

1.71

17.55%

2.24
Total ReturnsTotal Returns (Price + Dividend) 
Sampann Utpadan for the last several years.
Risk Adjusted Returns v/s
Returns Beta
 News & Corporate Actions
News
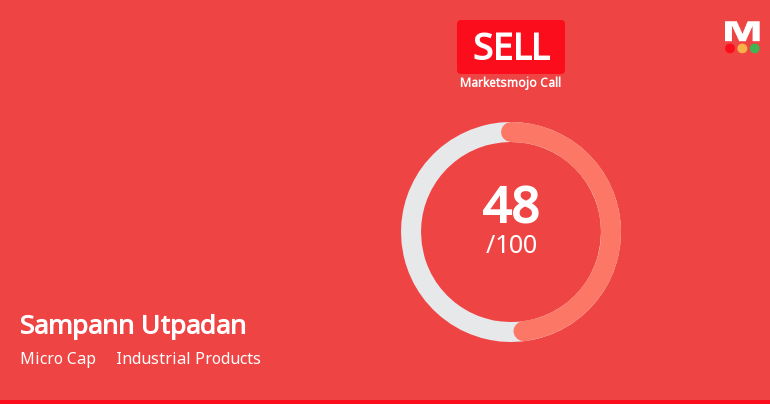
Sampann Utpadan India Ltd is Rated Sell
Sampann Utpadan India Ltd is rated 'Sell' by MarketsMOJO, with this rating last updated on 25 April 2026. However, the analysis and financial metrics discussed here reflect the stock's current position as of 19 November 2026, providing investors with an up-to-date view of the company’s fundamentals, returns, and market performance.
Read More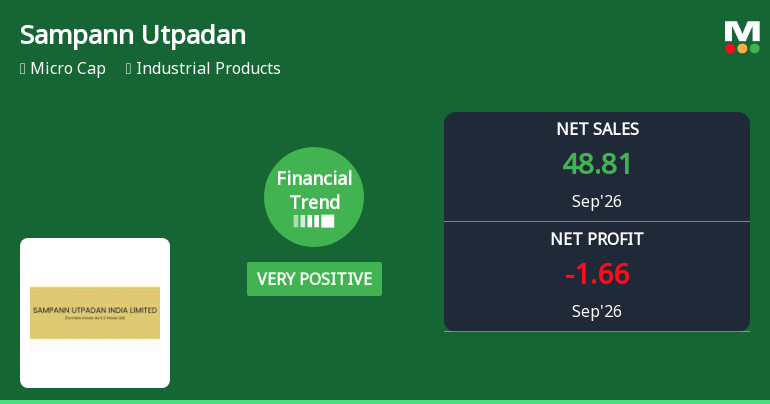
Sampann Utpadan India Ltd Reports Very Positive Quarterly Financial Performance Amid Mixed Market Returns
Sampann Utpadan India Ltd has demonstrated a marked improvement in its financial performance for the quarter ended September 2026, registering its highest quarterly net sales and profitability metrics in recent history. Despite a challenging market environment and a micro-cap status, the industrial products company’s financial trend has shifted from positive to very positive, signalling a potential turnaround in operational efficiency and growth prospects.
Read More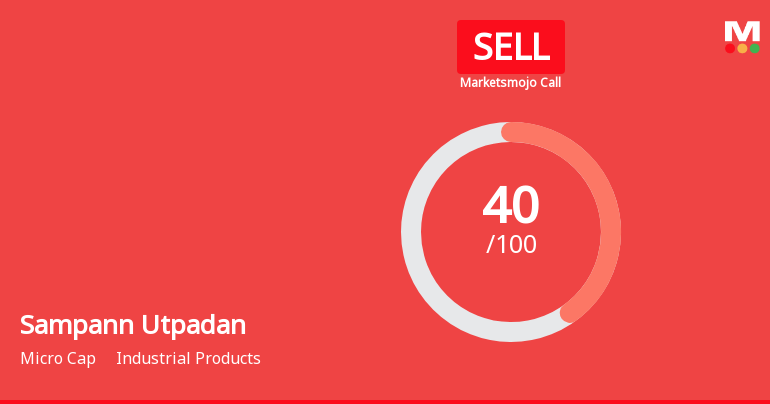
Sampann Utpadan India Ltd is Rated Sell
Sampann Utpadan India Ltd is rated 'Sell' by MarketsMOJO, with this rating last updated on 25 April 2026. However, the analysis and financial metrics discussed here reflect the stock's current position as of 30 October 2026, providing investors with an up-to-date perspective on the company’s performance and outlook.
Read More Announcements
Announcement under Regulation 30 (LODR)-Newspaper Publication
06-Nov-2026 | Source : BSEPublication of Unaudited Results for the quarter and half year ended 30.09.2026
Quarterly And Half-Year Ended 30.09.2026
05-Nov-2026 | Source : BSEUnaudited Quarterly and half-year results for the Quarter ended 30.09.2026
Board Meeting Outcome for Unaudited Quarterly Results For Q-2 And Half Year Ended 30.09.2026
05-Nov-2026 | Source : BSEUnaudited Quarterly Results for the Quarter and half year ended 30.09.2026
Corporate Actions

No Upcoming Board Meetings

No Dividend history available

No Splits history available

No Bonus history available

No Rights history available
Key FactorsQuality key factors
Valuation key factors
Technicals key factors
 Technical Indicator Scale: Bearish, Mildly Bearish, Sideways, Mildly Bullish, Bullish Turned Shareholding
Shareholding Snapshot : Sep 2026
Shareholding Compare (%holding)
Non Institution
None
Held by 0 Schemes
Held by 5 FIIs (17.26%)
Sachin Agarwal (0.0%)
Antara India Evergreen Fund Ltd (0%)
20.57%
FinancialQuarterly Results Snapshot (Consolidated) - Sep'26 - YoY
 Compare with Peers

YoY Growth in quarter ended Sep 2026 is 40.10% vs 65.12% in Sep 2025
YoY Growth in quarter ended Sep 2026 is -189.73% vs 263.72% in Sep 2025

Half Yearly Results Snapshot (Consolidated) - Sep'25

Growth in half year ended Sep 2025 is 63.53% vs 17.23% in Sep 2024
Growth in half year ended Sep 2025 is 237.83% vs -281.43% in Sep 2024
Nine Monthly Results Snapshot (Consolidated) - Dec'25
YoY Growth in nine months ended Dec 2025 is 59.51% vs 24.37% in Dec 2024
YoY Growth in nine months ended Dec 2025 is 477.03% vs -12.98% in Dec 2024
Annual Results Snapshot (Consolidated) - Mar'26
YoY Growth in year ended Mar 2026 is 46.28% vs 36.47% in Mar 2025
YoY Growth in year ended Mar 2026 is 70.35% vs 557.47% in Mar 2025
 Company CV
About Sampann Utpadan India Ltd

Company Coordinates


