
 Score
Dashboard
Weak Long Term Fundamental Strength with an average Return on Capital Employed (ROCE) of 0.48%
- Company's ability to service its debt is weak with a poor EBIT to Interest (avg) ratio of -0.85
With ROCE of 0.5, it has a Very Expensive valuation with a 0.5 Enterprise value to Capital Employed


 Total Returns
 (Price + Dividend) 
SAB Industries for the last several years.
Risk Adjusted Returns v/s
Returns Beta
 News & Corporate Actions
News
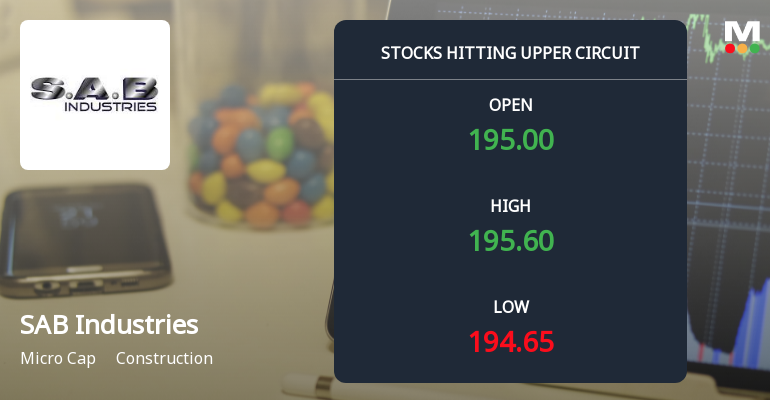
SAB Industries Ltd Locks at Upper Circuit With 5% Gain — Buyers Queue, Sellers Absent
At Rs 185.76, the buying was done — not because demand dried up, but because the exchange wouldn't let the stock go any higher. SAB Industries Ltd locked at its upper circuit of 5% on 17 Nov 2026, with buyers queuing and no sellers willing to part with shares.
Read More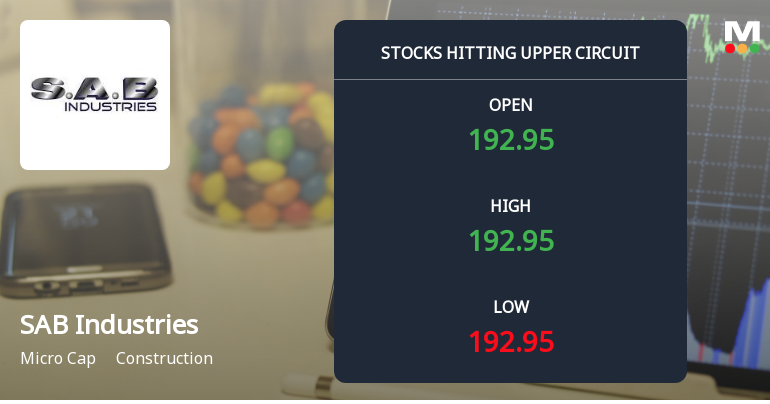
SAB Industries Ltd Locks at Upper Circuit With 5% Gain — Buyers Queue, Sellers Absent
At Rs 176.92, the buying was done — not because demand dried up, but because the exchange wouldn't let the stock go any higher. SAB Industries Ltd locked at its upper circuit of 5% on 16 Nov 2026, with buyers queuing and no sellers willing to part with shares.
Read More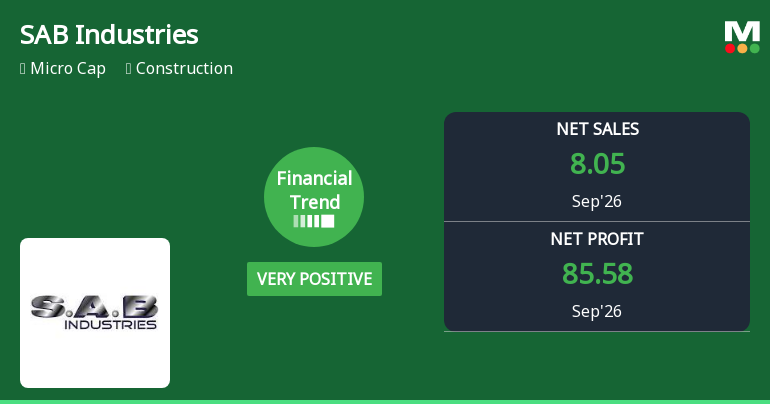
SAB Industries Ltd Reports Strong Quarterly Turnaround with Robust Profit Growth
SAB Industries Ltd has delivered a remarkable financial turnaround in the quarter ended September 2026, posting its highest-ever profit before tax and net profit figures, alongside significant revenue growth. This marks a decisive shift from the company’s previous negative financial trend, signalling renewed investor interest and a potential re-rating in the construction sector micro-cap.
Read More Announcements
Announcement under Regulation 30 (LODR)-Newspaper Publication
14-Nov-2026 | Source : BSENewspaper cutting of extract of unaudited financial results for the quarter and half year ended 30.09.2026.
Board Meeting Outcome for Outcome Of Board Meeting Held On 12.11.2026
12-Nov-2026 | Source : BSEOutcome of Board Meeting held on today i.e. 12.11.2026.
Unaudited Financial Results For The Quarter And Half Year Ended 30.09.2026
12-Nov-2026 | Source : BSEStandalone and consolidated unaudited financial results for the quarter and half year ended 30.09.2026.
Corporate Actions

No Upcoming Board Meetings

No Dividend history available

No Splits history available

No Bonus history available

No Rights history available
Key FactorsQuality key factors
Valuation key factors
Technicals key factors
 Technical Indicator Scale: Bearish, Mildly Bearish, Sideways, Mildly Bullish, Bullish Turned Shareholding
Shareholding Snapshot : Sep 2026
Shareholding Compare (%holding)
Promoters
None
Held by 6 Schemes (0.0%)
Held by 0 FIIs
Priya Garg (12.6%)
Bloomen Flora Limited (8.79%)
1.28%
FinancialQuarterly Results Snapshot (Consolidated) - Sep'26 - QoQ
 Compare with Peers

QoQ Growth in quarter ended Sep 2026 is 25.59% vs -49.29% in Jun 2026

QoQ Growth in quarter ended Sep 2026 is 198.08% vs 369.07% in Jun 2026

Half Yearly Results Snapshot (Consolidated) - Sep'25
Growth in half year ended Sep 2025 is -38.81% vs 13.53% in Sep 2024
Growth in half year ended Sep 2025 is 1,219.71% vs -103.21% in Sep 2024
Nine Monthly Results Snapshot (Consolidated) - Dec'25
YoY Growth in nine months ended Dec 2025 is -46.68% vs 36.07% in Dec 2024
YoY Growth in nine months ended Dec 2025 is 187.49% vs -117.66% in Dec 2024
Annual Results Snapshot (Consolidated) - Mar'26
YoY Growth in year ended Mar 2026 is -35.39% vs 3.05% in Mar 2025
YoY Growth in year ended Mar 2026 is 90.19% vs -154.26% in Mar 2025
 Company CV
About SAB Industries Ltd

Company Coordinates


