
 Score
Dashboard
With a Negative Book Value, the company has a Weak Long Term Fundamental Strength
- Poor long term growth as Net Sales has grown by an annual rate of 30.30% and Operating profit at 0%
Flat results in Sep 26
Stock is technically in a Bearish range
Risky - Negative EBITDA
Below par performance in long term as well as near term
Mojo ParametersStock DNA

Non Banking Financial Company (NBFC)

INR 21 Cr (Micro Cap)

NA (Loss Making)
20

0.00%

-1.00

6.02%

-4.08
Total ReturnsTotal Returns (Price + Dividend) 
Roselabs Finance for the last several years.
Risk Adjusted Returns v/s
Returns Beta
 News & Corporate Actions
News
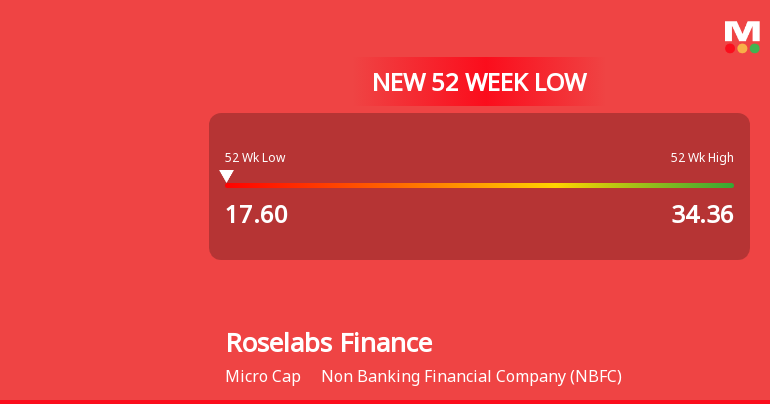
Roselabs Finance Ltd Falls to 52-Week Low of Rs 17.6 as Sell-Off Deepens
For the fifth consecutive session, Roselabs Finance Ltd closed lower, hitting a fresh 52-week low of Rs 17.6 on 09 Oct 2026. This decline comes amid a broader market that is showing signs of recovery, with the Sensex gaining 1.07% on the same day, underscoring a stark divergence between the stock and the benchmark index.
Read More Announcements
Announcement under Regulation 30 (LODR)-Newspaper Publication
23-Oct-2026 | Source : BSEUnaudited Financial Results along with Limited Review Report for the quarter and half year ended September 30 2026
Un-Audited Financial Results Alongwith Limited Review Report Of The Company For The Quarter And Half Year Ended September 30 2026
22-Oct-2026 | Source : BSEUn-Audited Financial Results Alongwith Limited Review Report Of The Company For The Quarter And Half Year ended September 30 2026
Board Meeting Outcome for Board Meeting Outcome For Consideration And Approval Of The Un-Audited Financial Results Alongwith Limited Review Report Of The Company For The Quarter And Half Year Ended September 30 2026
22-Oct-2026 | Source : BSEUn-Audited Financial Results Alongwith Limited Review Report Of The Company For The Quarter and Half Year ended September 30 2026
Corporate Actions

No Upcoming Board Meetings

No Dividend history available

No Splits history available

No Bonus history available

No Rights history available
Key FactorsQuality key factors
Valuation key factors
Technicals key factors
 Technical Indicator Scale: Bearish, Mildly Bearish, Sideways, Mildly Bullish, Bullish Turned Shareholding
Shareholding Snapshot : Sep 2026
Shareholding Compare (%holding)
Promoters
None
Held by 0 Schemes
Held by 0 FIIs
Lodha Developers Limited (74.25%)
Arhanathji Builders And Farms Pvt Ltd (4.96%)
15.12%
FinancialQuarterly Results Snapshot (Standalone) - Sep'26 - QoQ
 Compare with Peers
QoQ Growth in quarter ended Sep 2026 is 0.00% vs 0.00% in Jun 2026

QoQ Growth in quarter ended Sep 2026 is -20.00% vs 68.75% in Jun 2026

Half Yearly Results Snapshot (Standalone) - Sep'25
Growth in half year ended Sep 2025 is 0.00% vs 0.00% in Sep 2024

Growth in half year ended Sep 2025 is 21.43% vs -40.00% in Sep 2024
Nine Monthly Results Snapshot (Standalone) - Dec'25
YoY Growth in nine months ended Dec 2025 is 0.00% vs 0.00% in Dec 2024
YoY Growth in nine months ended Dec 2025 is 40.00% vs -92.31% in Dec 2024
Annual Results Snapshot (Standalone) - Mar'26
YoY Growth in year ended Mar 2026 is 70.42% vs -37.72% in Mar 2025
YoY Growth in year ended Mar 2026 is -6.90% vs -123.08% in Mar 2025
 Company CV
About Roselabs Finance Ltd

Company Coordinates


