
 Score
Dashboard
Weak Long Term Fundamental Strength with an average Return on Equity (ROE) of 2.83%
- Poor long term growth as Operating profit has grown by an annual rate of -9.88%
Flat results in Sep 26
Stock is technically in a Mildly Bearish range
With ROE of 2, it has a Very Expensive valuation with a 1 Price to Book Value
77.32% of Promoter Shares are Pledged
Mojo ParametersStock DNA

Non Banking Financial Company (NBFC)

INR 28 Cr (Micro Cap)

49.00
20

0.00%

0.12

2.05%

0.99
Total ReturnsTotal Returns (Price + Dividend) 
Rita Finance and for the last several years.
Risk Adjusted Returns v/s
Returns Beta
 News & Corporate Actions
News
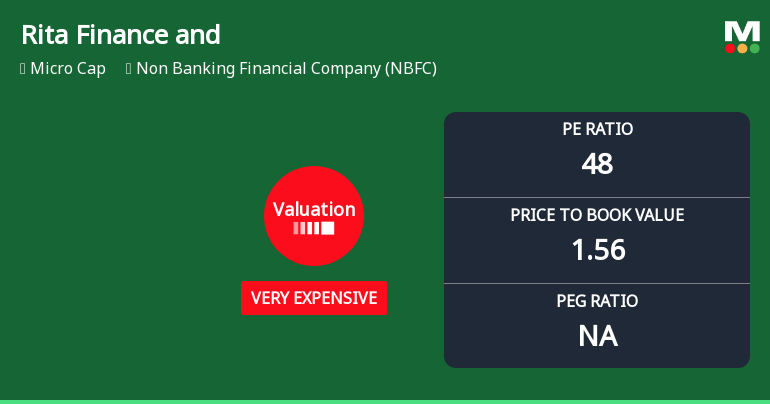
Rita Finance and Leasing Ltd Valuation Shifts Signal Heightened Price Risk
Rita Finance and Leasing Ltd, a micro-cap player in the Non Banking Financial Company (NBFC) sector, has seen its valuation metrics deteriorate sharply, moving from expensive to very expensive territory. With a price-to-earnings (P/E) ratio of 47.6 and a price-to-book value (P/BV) of 1.56, the stock’s price attractiveness has diminished considerably compared to its historical averages and peer group, raising concerns for investors amid mixed financial performance and subdued returns.
Read More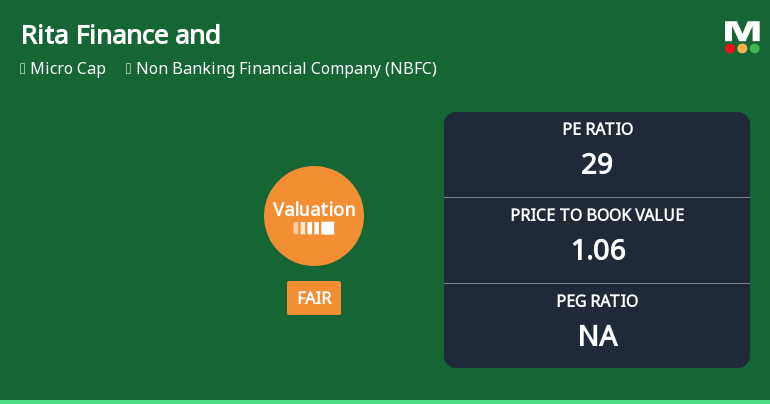
Rita Finance and Leasing Ltd Valuation Shifts Signal Changing Market Sentiment
Rita Finance and Leasing Ltd, a micro-cap player in the Non Banking Financial Company (NBFC) sector, has seen a notable shift in its valuation parameters, moving from an expensive to a fair valuation grade. Despite this adjustment, the company continues to face significant headwinds, reflected in its deteriorating stock performance and a strong sell recommendation from MarketsMOJO.
Read More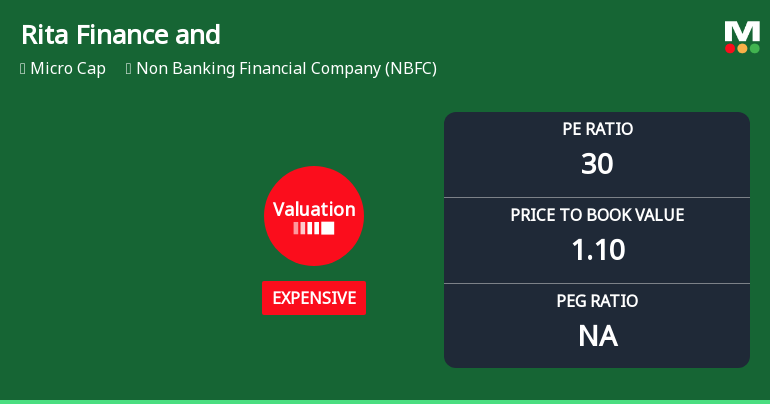
Rita Finance and Leasing Ltd Valuation Shifts Signal Elevated Risk Amid Market Underperformance
Rita Finance and Leasing Ltd, a micro-cap player in the Non Banking Financial Company (NBFC) sector, has seen a marked shift in its valuation parameters, moving from a non-qualifying valuation status to being categorised as expensive. This change, coupled with a recent downgrade in its Mojo Grade to Strong Sell, highlights growing concerns about the stock’s price attractiveness amid subdued financial performance and challenging market conditions.
Read More Announcements
Disclosures under Reg. 31(1) and 31(2) of SEBI (SAST) Regulations 2011.
17-Nov-2026 | Source : BSEThe Exchange has received Disclosure under Regulation 31(1) and 31(2) of SEBI (Substantial Acquisition of Shares & Takeovers) Regulations 2011 on November 17 2026 for Pawan Kumar Mittal
Submission Of Standalone Unaudited Financial Results For The Second Quarter And Half Year Ended On 30.09.2026 And Disclosure Pursuant To Regulation 33 Of SEBI (LODR) Regulations 2015
03-Nov-2026 | Source : BSESubmission of Standalone Unaudited Financial Results for the Second Quarter and Half year ended on 30.09.2026
Statement Of Deviation Or Variation In Utilization Of Funds Raised Under Preferential Issue - Regulation 32 Of The SEBI (Listing Obligations And Disclosure Requirements Regulations 2015
03-Nov-2026 | Source : BSEStatement of Deviation or Variation
Corporate Actions

No Upcoming Board Meetings

No Dividend history available

No Splits history available

No Bonus history available

No Rights history available
Key FactorsQuality key factors
Valuation key factors
Technicals key factors
 Technical Indicator Scale: Bearish, Mildly Bearish, Sideways, Mildly Bullish, Bullish Turned Shareholding
Shareholding Snapshot : Sep 2026
Shareholding Compare (%holding)
Non Institution
77.3174
Held by 0 Schemes
Held by 0 FIIs
Pawan Kumar Mittal (22.34%)
Bhoomi Jitesh Shah (2.77%)
63.87%
FinancialQuarterly Results Snapshot (Standalone) - Sep'26 - QoQ
 Compare with Peers

QoQ Growth in quarter ended Sep 2026 is -25.58% vs 13.16% in Jun 2026
QoQ Growth in quarter ended Sep 2026 is -6.67% vs 25.00% in Jun 2026

Half Yearly Results Snapshot (Standalone) - Sep'25

Growth in half year ended Sep 2025 is 27.27% vs -9.84% in Sep 2024
Growth in half year ended Sep 2025 is 61.54% vs -35.00% in Sep 2024
Nine Monthly Results Snapshot (Standalone) - Dec'25
YoY Growth in nine months ended Dec 2025 is 31.94% vs -19.10% in Dec 2024
YoY Growth in nine months ended Dec 2025 is 90.00% vs -47.37% in Dec 2024
Annual Results Snapshot (Standalone) - Mar'26
YoY Growth in year ended Mar 2026 is 29.13% vs -14.88% in Mar 2025
YoY Growth in year ended Mar 2026 is 15.00% vs 50.00% in Mar 2025
 Company CV
About Rita Finance and Leasing Ltd

Company Coordinates


