
 Score
Dashboard
Low ability to service debt as the company has a high Debt to EBITDA ratio of 3.70 times
- Low ability to service debt as the company has a high Debt to EBITDA ratio of 3.70 times
Poor long term growth as Operating profit has grown by an annual rate -358.73% of over the last 5 years
Flat results in Sep 26
Stock is technically in a Bearish range
Risky - Negative EBITDA
Mojo ParametersStock DNA

E-Retail/ E-Commerce

INR 3,338 Cr (Small Cap)

NA (Loss Making)
28

0.00%

0.29

-36.83%

4.48
Total ReturnsTotal Returns (Price + Dividend) 
RattanIndia Ent for the last several years.
Risk Adjusted Returns v/s
Returns Beta
 News & Corporate Actions
News
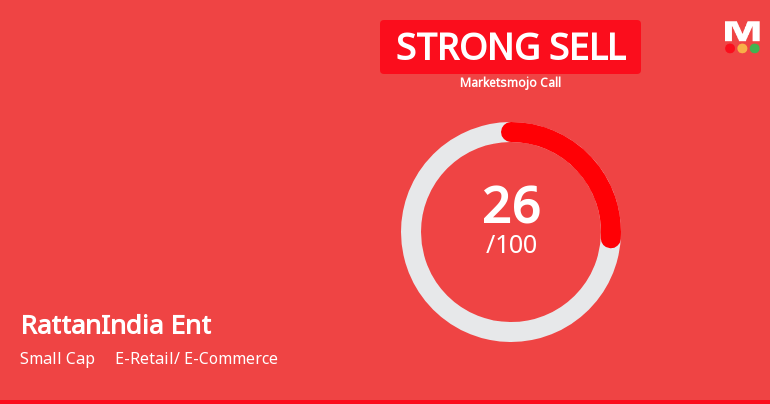
RattanIndia Enterprises Downgraded to Strong Sell Amid Weak Financials and Technical Signals
RattanIndia Enterprises Ltd has been downgraded from a Sell to a Strong Sell rating by MarketsMojo as of 16 Nov 2026, reflecting deteriorating fundamentals and a challenging technical outlook. Despite some mild improvements in technical indicators, the company’s financial health and valuation metrics remain under significant pressure, prompting a cautious stance from investors.
Read More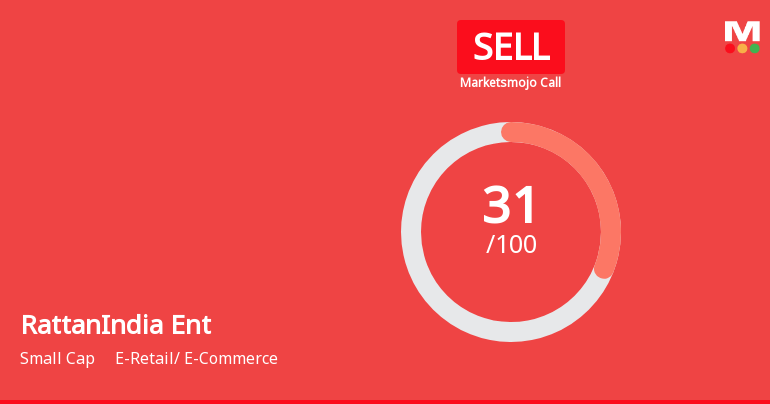
RattanIndia Enterprises Ltd is Rated Sell
RattanIndia Enterprises Ltd is rated 'Sell' by MarketsMOJO, with this rating last updated on 11 November 2026. While the rating was revised on that date, the analysis and financial metrics discussed here reflect the stock's current position as of 13 November 2026, providing investors with the most up-to-date perspective on the company’s fundamentals and market performance.
Read More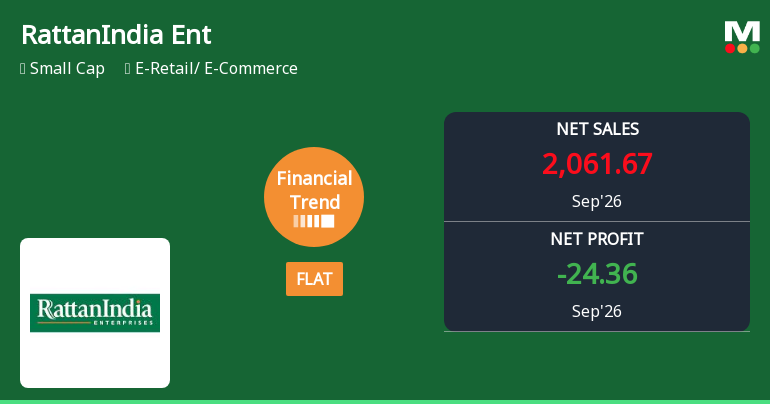
RattanIndia Enterprises Ltd Reports Flat Quarterly Performance Amid Margin Pressures
RattanIndia Enterprises Ltd, a small-cap player in the e-retail and e-commerce sector, has reported a flat financial performance for the quarter ended September 2026, signalling a potential stabilisation after a period of decline. The company’s financial trend score improved markedly from -8 to -1 over the past three months, reflecting a shift from negative to neutral momentum despite persistent challenges such as elevated interest expenses.
Read More Announcements
Announcement under Regulation 30 (LODR)-Press Release / Media Release
04-Nov-2026 | Source : BSEPlease find enclosed herewith a copy of the press release from the Company for your information and records.
Investors Presentation
03-Nov-2026 | Source : BSEInvestors Presentation
Financial Results
03-Nov-2026 | Source : BSEFinancial results
Corporate Actions

No Upcoming Board Meetings

No Dividend history available

No Splits history available

No Bonus history available

No Rights history available
Key FactorsQuality key factors
Valuation key factors
Technicals key factors
 Technical Indicator Scale: Bearish, Mildly Bearish, Sideways, Mildly Bullish, Bullish Turned Shareholding
Shareholding Snapshot : Sep 2026
Shareholding Compare (%holding)
Promoters
15.7156
Held by 1 Schemes (0.0%)
Held by 25 FIIs (5.38%)
Laurel Energetics Private Limited (39.31%)
Nova Global Opportunities Fund Pcc - Touchstone (2.23%)
15.66%
FinancialQuarterly Results Snapshot (Consolidated) - Sep'26 - YoY
 Compare with Peers

YoY Growth in quarter ended Sep 2026 is -2.93% vs 17.95% in Sep 2025

YoY Growth in quarter ended Sep 2026 is 93.86% vs -64.36% in Sep 2025

Half Yearly Results Snapshot (Consolidated) - Sep'25
Growth in half year ended Sep 2025 is -1.17% vs 30.46% in Sep 2024
Growth in half year ended Sep 2025 is -82.61% vs 90.97% in Sep 2024
Nine Monthly Results Snapshot (Consolidated) - Dec'25
YoY Growth in nine months ended Dec 2025 is 0.64% vs 19.76% in Dec 2024
YoY Growth in nine months ended Dec 2025 is -112.52% vs -13.23% in Dec 2024
Annual Results Snapshot (Consolidated) - Mar'26
YoY Growth in year ended Mar 2026 is 0.00% vs -100.00% in Mar 2025
YoY Growth in year ended Mar 2026 is -295.90% vs -80.19% in Mar 2025
 Company CV
About RattanIndia Enterprises Ltd

Company Coordinates


