
 Score
Dashboard
High Debt company with Weak Long Term Fundamental Strength
- High Debt Company with a Debt to Equity ratio (avg) at 3.02 times
- The company has been able to generate a Return on Equity (avg) of 4.61% signifying low profitability per unit of shareholders funds
The company has declared negative results for the last 5 consecutive quarters
With ROCE of 10.8, it has a Very Expensive valuation with a 2.2 Enterprise value to Capital Employed


 Total Returns
 (Price + Dividend) 
Ratnabhumi Dev. for the last several years.
Risk Adjusted Returns v/s
Returns Beta
 News & Corporate Actions
News
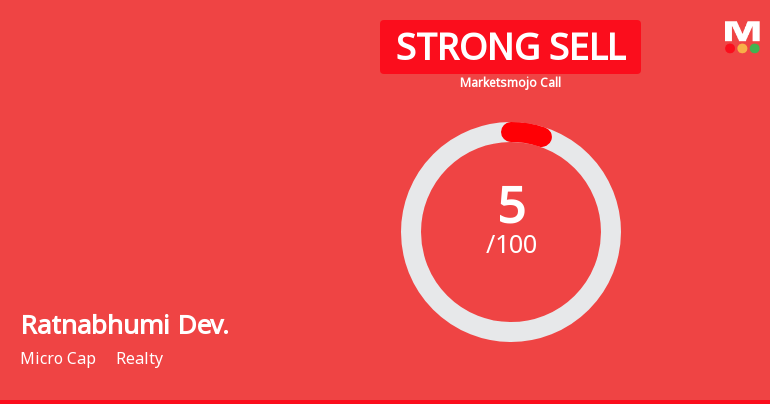
Ratnabhumi Developers Ltd is Rated Strong Sell
Ratnabhumi Developers Ltd is rated Strong Sell by MarketsMOJO. This rating was last updated on 28 October 2026, reflecting a reassessment of the stock’s outlook. However, all fundamentals, returns, and financial metrics discussed below are current as of 11 November 2026, providing investors with the latest perspective on the company’s position.
Read More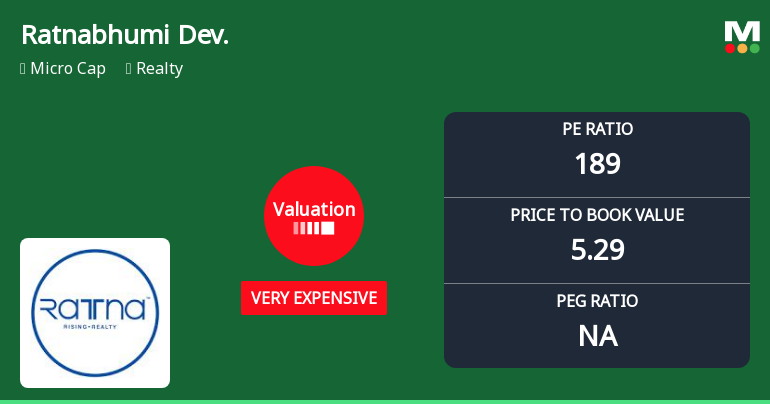
Ratnabhumi Developers Ltd Valuation Surges to Very Expensive Amidst Market Underperformance
Ratnabhumi Developers Ltd, a micro-cap player in the realty sector, has witnessed a marked deterioration in its valuation parameters, prompting a downgrade in its investment grade to Strong Sell. With a price-to-earnings (P/E) ratio soaring to 189.35 and price-to-book value (P/BV) at 5.29, the stock now trades at a premium that appears disconnected from its recent financial performance and peer comparisons.
Read More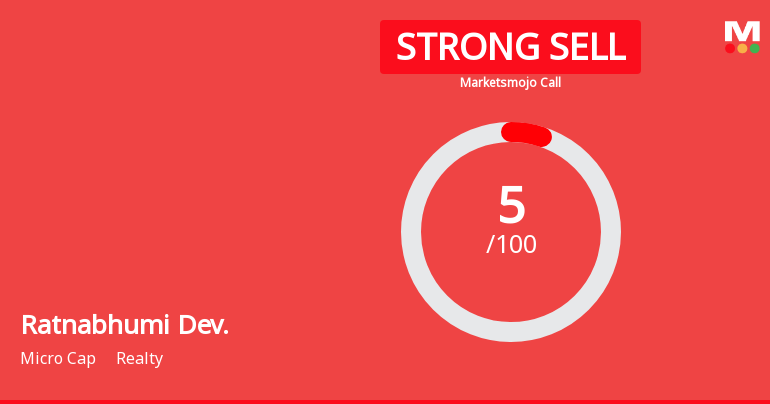
Ratnabhumi Developers Ltd is Rated Strong Sell
Ratnabhumi Developers Ltd is rated Strong Sell by MarketsMOJO. This rating was last updated on 16 June 2026. However, the analysis and financial metrics discussed here reflect the stock’s current position as of 16 October 2026, providing investors with the latest insights into the company’s performance and outlook.
Read More Announcements
Announcement under Regulation 30 (LODR)-Newspaper Publication
07-Nov-2026 | Source : BSENewspaper Publication of Financial results for the Qrater and Half year ended 30th September 2026 in todays (07th November 2026) Financial Express Newspaper in English and Gujarati Languages.
Financial Results For The Quarter And Half Year Ended 30Th September 2026
05-Nov-2026 | Source : BSEUnaudited Standalone and Consolidated Financial Results for the Quarter and Half year ended 30th September 2026
Board Meeting Outcome for Board Meeting Outcome For Meeting Held On 05Th November 2026
05-Nov-2026 | Source : BSETo consider and approve the unaudited standalone and consolidated Financial Results for the Quarter and Half Year ended 30th September 2026
Corporate Actions

No Upcoming Board Meetings

No Dividend history available

No Splits history available

No Bonus history available

No Rights history available
Key FactorsQuality key factors
Valuation key factors
Technicals key factors
 Technical Indicator Scale: Bearish, Mildly Bearish, Sideways, Mildly Bullish, Bullish Turned Shareholding
Shareholding Snapshot : Sep 2026
Shareholding Compare (%holding)
Promoters
None
Held by 0 Schemes
Held by 0 FIIs
Kaivan Jitendrakumar Shah (73.56%)
Trine Projects India Private Limited (5.69%)
15.84%
FinancialQuarterly Results Snapshot (Consolidated) - Sep'26 - YoY
 Compare with Peers

YoY Growth in quarter ended Sep 2026 is -28.33% vs -87.41% in Sep 2025

YoY Growth in quarter ended Sep 2026 is -100.00% vs -51.92% in Sep 2025

Half Yearly Results Snapshot (Consolidated) - Sep'25
Growth in half year ended Sep 2025 is -70.81% vs 40,015.15% in Sep 2024
Growth in half year ended Sep 2025 is -10.71% vs 4,100.00% in Sep 2024
Nine Monthly Results Snapshot (Consolidated) - Dec'25
YoY Growth in nine months ended Dec 2025 is -73.99% vs 31,285.96% in Dec 2024
YoY Growth in nine months ended Dec 2025 is -8.04% vs 3,787.50% in Dec 2024
Annual Results Snapshot (Consolidated) - Mar'26
YoY Growth in year ended Mar 2026 is -71.21% vs 76,139.29% in Mar 2025
YoY Growth in year ended Mar 2026 is -45.20% vs 2,103.85% in Mar 2025
 Company CV
About Ratnabhumi Developers Ltd

Company Coordinates


