
 Score
Dashboard
With a Operating Losses, the company has a Weak Long Term Fundamental Strength
- Poor long term growth as Operating profit has grown by an annual rate -209.44% of over the last 5 years
- Company's ability to service its debt is weak with a poor EBIT to Interest (avg) ratio of 0.49
Flat results in Sep 26
Risky - Negative EBITDA
Mojo ParametersStock DNA

Non Banking Financial Company (NBFC)

INR 12 Cr (Micro Cap)

NA (Loss Making)
9

0.00%

-0.05

-6.91%

0.59
Total ReturnsTotal Returns (Price + Dividend) 
Latest dividend: 0.7 per share ex-dividend date: Aug-28-2013
Risk Adjusted Returns v/s
Returns Beta
 News & Corporate Actions
News
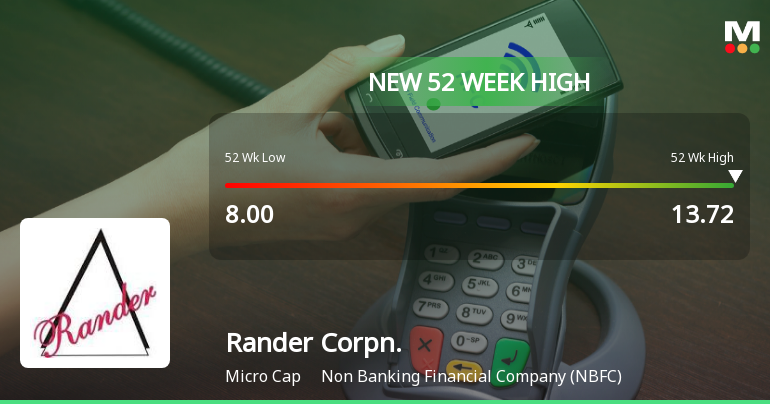
Broad-Based Technical Strength Lifts Rander Corporation Ltd to 52-Week High of Rs 13.72
Rander Corporation Ltd has surged to a fresh 52-week high of Rs 13.72 on 31 Aug 2026, marking a significant milestone in its price momentum. This rally comes amid a backdrop of sustained gains over the past four trading sessions, during which the stock has appreciated nearly 20%, outperforming its sector by over 5% today alone.
Read More Announcements
Financial Results For The Quarter And Half Year Ended September 30 2026
13-Nov-2026 | Source : BSEFinancial Results for the Quarter and Half-year Ended September 30 2026.
Board Meeting Outcome for Outcome Of The Board Meeting Held On
13-Nov-2026 | Source : BSEBoard Meeting Intimation for Board Meeting Intimation For Financial Results For The Quarter And Half Year Ended September 30 2026
04-Nov-2026 | Source : BSERander Corporation Ltdhas informed BSE that the meeting of the Board of Directors of the Company is scheduled on 13/11/2026 inter alia to consider and approve 1. Un-audited Financial Results of the Company for the quarter and Half year ended September 30 2026 together with Auditors Report thereon
Corporate Actions

No Upcoming Board Meetings

Rander Corporation Ltd has declared 7% dividend, ex-date: 28 Aug 13

Rander Corporation Ltd has announced 10:1 stock split, ex-date: 26 Nov 15

No Bonus history available

No Rights history available
Key FactorsQuality key factors
Valuation key factors
Technicals key factors
 Technical Indicator Scale: Bearish, Mildly Bearish, Sideways, Mildly Bullish, Bullish Turned Shareholding
Shareholding Snapshot : Sep 2026
Shareholding Compare (%holding)
Non Institution
None
Held by 0 Schemes
Held by 0 FIIs
Amarchand Ratanlal Rander (5.0%)
Gulistan Vanijya Pvt. Ltd. (3.94%)
34.77%
FinancialQuarterly Results Snapshot (Standalone) - Sep'26 - QoQ
 Compare with Peers

QoQ Growth in quarter ended Sep 2026 is -17.18% vs 38.14% in Jun 2026
QoQ Growth in quarter ended Sep 2026 is -163.89% vs 118.09% in Jun 2026

Half Yearly Results Snapshot (Standalone) - Sep'25

Growth in half year ended Sep 2025 is 328.57% vs -42.47% in Sep 2024
Growth in half year ended Sep 2025 is 64.29% vs -46.15% in Sep 2024
Nine Monthly Results Snapshot (Standalone) - Dec'25
YoY Growth in nine months ended Dec 2025 is 192.59% vs -40.33% in Dec 2024
YoY Growth in nine months ended Dec 2025 is 400.00% vs -84.81% in Dec 2024
Annual Results Snapshot (Standalone) - Mar'26
YoY Growth in year ended Mar 2026 is 206.38% vs -64.66% in Mar 2025
YoY Growth in year ended Mar 2026 is -166.67% vs -129.03% in Mar 2025
 Company CV
About Rander Corporation Ltd

Company Coordinates


