
 Score
Dashboard
With a Operating Losses, the company has a Weak Long Term Fundamental Strength
- Low ability to service debt as the company has a high Debt to EBITDA ratio of 20.76 times
- The company has reported losses. Due to this company has reported negative ROE
Negative results in Sep 26
Stock is technically in a Mildly Bearish range
Risky - Negative Operating Profits
Consistent Underperformance against the benchmark over the last 3 years
Mojo ParametersStock DNA

Garments & Apparels

INR 21 Cr (Micro Cap)

NA (Loss Making)
24

0.00%

0.99

-6.58%

0.43
Total ReturnsTotal Returns (Price + Dividend) 
Prakash Woollen for the last several years.
Risk Adjusted Returns v/s
Returns Beta
 News & Corporate Actions
News
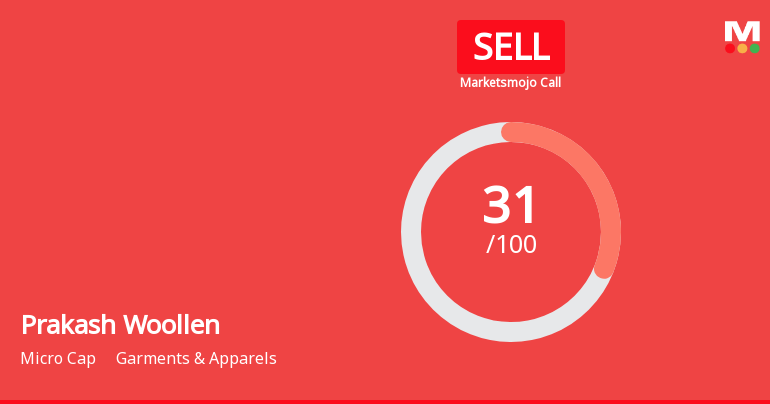
Prakash Woollen & Synthetic Mills Ltd Upgraded to Sell on Technical Improvements
Prakash Woollen & Synthetic Mills Ltd has seen its investment rating upgraded from Strong Sell to Sell as of 14 Oct 2026, driven primarily by a shift in technical indicators despite ongoing fundamental challenges. The garment and apparel micro-cap’s Mojo Score improved to 31.0, reflecting a more optimistic technical outlook, even as financial performance remains subdued with operating losses and weak long-term fundamentals.
Read More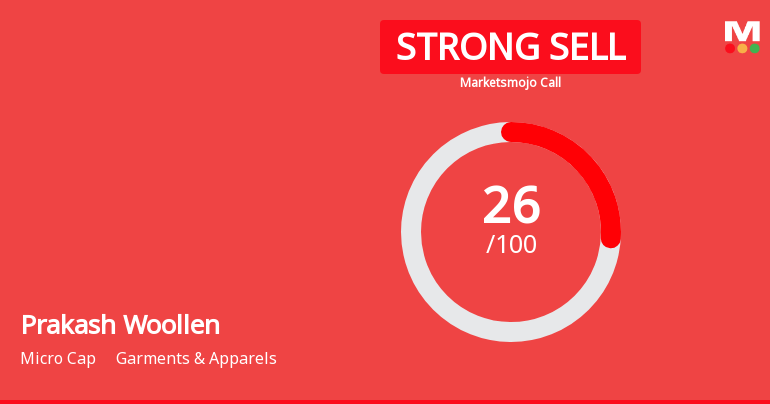
Prakash Woollen & Synthetic Mills Downgraded to Strong Sell Amid Weak Fundamentals and Bearish Technicals
Prakash Woollen & Synthetic Mills Ltd, a micro-cap player in the Garments & Apparels sector, has seen its investment rating downgraded from Sell to Strong Sell as of 8 October 2026. This revision reflects deteriorating technical indicators, stagnant financial performance, and valuation concerns, signalling heightened risk for investors amid a challenging market environment.
Read More
Prakash Woollen & Synthetic Mills Ltd Upgraded to Sell on Technical Improvements
Prakash Woollen & Synthetic Mills Ltd has seen its investment rating upgraded from Strong Sell to Sell, driven primarily by a shift in technical indicators despite persistent fundamental challenges. The garment and apparel micro-cap’s recent performance and valuation metrics present a mixed picture, with technical trends improving moderately while financial and quality parameters remain subdued.
Read More Announcements
Announcement under Regulation 30 (LODR)-Newspaper Publication
07-Nov-2026 | Source : BSENewspaper Publication of unaudited financial results for the quarter and half year ended on 30.09.2026.
UNAUDITED FINANCIAL RESULTS (STANDALONE) FOR THE SECOND QUARTER AND HALF YEAR ENDED SEPTEMBER 30 2026.
06-Nov-2026 | Source : BSEUnaudited Financial Results for the second quarter and half year ended on 30.09.2026.
Board Meeting Outcome for OUTCOME OF THE MEETING OF BOARD OF DIRECTORS HELD TODAY 06TH NOVEMBER 2026 AS PER REGULATION 30 OF THE SEBI (LISTING OBLIGATIONS AND DISCLOSURE REQUIREMENTS) REGULATIONS 2015
06-Nov-2026 | Source : BSEOUTCOME OF THE MEETING OF BOARD OF DIRECTORS HELD TODAY 06TH NOVEMBER 2026 AS PER REGULATION 30 OF THE SEBI (LISTING OBLIGATIONS AND DISCLOSURE REQUIREMENTS) REGULATIONS 2015
Corporate Actions

No Upcoming Board Meetings

No Dividend history available

No Splits history available

No Bonus history available

No Rights history available
Key FactorsQuality key factors
Valuation key factors
Technicals key factors
 Technical Indicator Scale: Bearish, Mildly Bearish, Sideways, Mildly Bullish, Bullish Turned Shareholding
Shareholding Snapshot : Sep 2026
Shareholding Compare (%holding)
Promoters
None
Held by 1 Schemes (0.13%)
Held by 0 FIIs
Adeep Gupta Huf (6.52%)
Narveer Yadav (3.53%)
32.0%
FinancialQuarterly Results Snapshot (Standalone) - Sep'26 - YoY
 Compare with Peers

YoY Growth in quarter ended Sep 2026 is -7.51% vs -4.88% in Sep 2025
YoY Growth in quarter ended Sep 2026 is -439.29% vs 71.72% in Sep 2025

Half Yearly Results Snapshot (Standalone) - Sep'25

Growth in half year ended Sep 2025 is 2.73% vs 1.76% in Sep 2024
Growth in half year ended Sep 2025 is 64.12% vs 17.61% in Sep 2024
Nine Monthly Results Snapshot (Standalone) - Dec'25
YoY Growth in nine months ended Dec 2025 is -4.87% vs -24.67% in Dec 2024
YoY Growth in nine months ended Dec 2025 is 62.84% vs -332.41% in Dec 2024
Annual Results Snapshot (Standalone) - Mar'26
YoY Growth in year ended Mar 2026 is 1.03% vs 2.98% in Mar 2025
YoY Growth in year ended Mar 2026 is -170.63% vs 31.25% in Mar 2025
 Company CV
About Prakash Woollen & Synthetic Mills Ltd

Company Coordinates


