
 Score
Dashboard
With a growth in Net Profit of 21.82%, the company declared Outstanding results in Sep 26
- The company has declared positive results for the last 5 consecutive quarters
- NET SALES(Q) Highest at Rs 2,624.50 cr
- PBDIT(Q) Highest at Rs 1,570.91 cr.
- OPERATING PROFIT TO NET SALES(Q) Highest at 59.86%
Stock is technically in a Bullish range
High Institutional Holdings at 28.8%
Company is among the highest 1% of companies rated by MarketsMojo across all 4,000 stocks
Market Beating performance in long term as well as near term
Mojo ParametersStock DNA

Non Banking Financial Company (NBFC)

INR 43,803 Cr (Mid Cap)

42.00
20

0.00%

4.31

7.91%

3.23
Total ReturnsTotal Returns (Price + Dividend) 
Latest dividend: 2 per share ex-dividend date: Jan-31-2024
Risk Adjusted Returns v/s
Returns Beta
 News & Corporate Actions
News
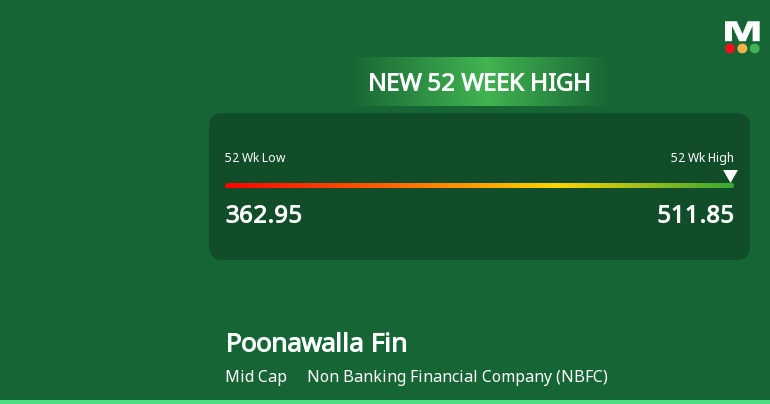
Broad-Based Technical Strength Lifts Poonawalla Fincorp Ltd to 52-Week High of Rs 512
After a steady ascent from its 52-week low of Rs 362.95, Poonawalla Fincorp Ltd has surged to a fresh 52-week high of Rs 512 on 20 Nov 2026, marking a 41% rally over the past year. This milestone is underscored by a confluence of strong technical indicators and sustained price momentum, even as the broader market, represented by the Sensex, trades close to its own yearly peak.
Read More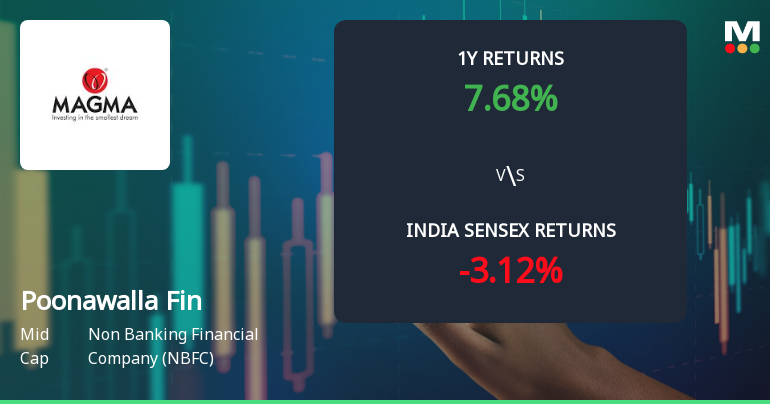
Poonawalla Fincorp Ltd Technical Momentum Shifts Signal Bullish Outlook
Poonawalla Fincorp Ltd has exhibited a notable shift in technical momentum, with key indicators signalling a transition from mildly bullish to a more confident bullish stance. This change is underscored by strong weekly and monthly MACD and Bollinger Bands readings, alongside daily moving averages confirming upward momentum. The stock’s recent price action and technical parameters suggest a positive outlook amid a competitive NBFC sector backdrop.
Read More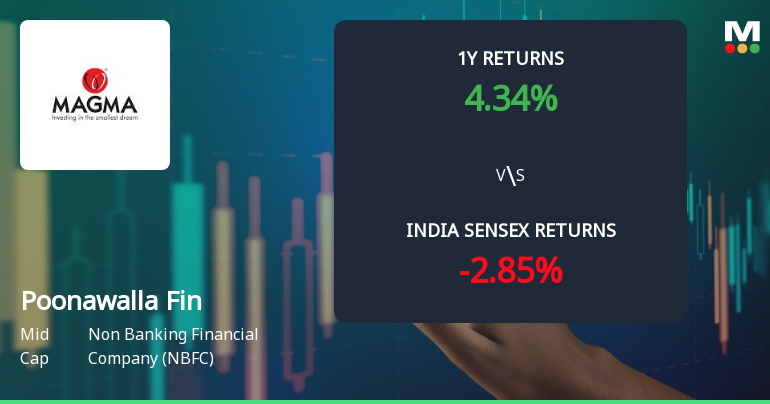
Poonawalla Fincorp Ltd Technical Momentum Shifts Amid Mixed Signals
Poonawalla Fincorp Ltd, a mid-cap player in the Non Banking Financial Company (NBFC) sector, has experienced a subtle shift in its technical momentum, moving from a bullish to a mildly bullish stance. Despite a minor dip in the stock price, the underlying technical indicators present a nuanced picture, reflecting both strength and caution for investors navigating the current market environment.
Read More Announcements
Announcement under Regulation 30 (LODR)-Issue of Securities
19-Nov-2026 | Source : BSEDisclosure under Regulation 30 and 51 of the SEBI Listing Regulations - Issue of Non-Convertible Debentures
Announcement under Regulation 30 (LODR)-Allotment
18-Nov-2026 | Source : BSEIntimation w.r.t allotment of Non-Convertible Debentures
Shareholder Meeting / Postal Ballot-Outcome of Postal_Ballot
16-Nov-2026 | Source : BSEIntimation w.r.t Outcome of Postal Ballot
Corporate Actions

No Upcoming Board Meetings

Poonawalla Fincorp Ltd has declared 100% dividend, ex-date: 31 Jan 24

Poonawalla Fincorp Ltd has announced 2:10 stock split, ex-date: 13 Aug 10

No Bonus history available

No Rights history available
Key FactorsQuality key factors
Valuation key factors
Technicals key factors
 Technical Indicator Scale: Bearish, Mildly Bearish, Sideways, Mildly Bullish, Bullish Turned Shareholding
Shareholding Snapshot : Sep 2026
Shareholding Compare (%holding)
Promoters
None
Held by 24 Schemes (11.75%)
Held by 179 FIIs (11.64%)
Rising Sun Holdings Pvt Ltd (59.01%)
Kotak Midcap Fund (6.87%)
8.61%
FinancialQuarterly Results Snapshot (Consolidated) - Sep'26 - QoQ
 Compare with Peers

QoQ Growth in quarter ended Sep 2026 is 12.63% vs 10.15% in Jun 2026
QoQ Growth in quarter ended Sep 2026 is 21.82% vs 20.77% in Jun 2026

Half Yearly Results Snapshot (Consolidated) - Sep'25
Growth in half year ended Sep 2025 is 45.25% vs 37.38% in Sep 2024
Growth in half year ended Sep 2025 is 176.25% vs -116.52% in Sep 2024
Nine Monthly Results Snapshot (Consolidated) - Dec'25
YoY Growth in nine months ended Dec 2025 is 54.61% vs 37.81% in Dec 2024
YoY Growth in nine months ended Dec 2025 is 278.64% vs -111.89% in Dec 2024
Annual Results Snapshot (Consolidated) - Mar'26
YoY Growth in year ended Mar 2026 is 62.07% vs 34.76% in Mar 2025
YoY Growth in year ended Mar 2026 is 650.96% vs -105.84% in Mar 2025
 Company CV
About Poonawalla Fincorp Ltd

Company Coordinates


