
 Mojo Parameters
Stock DNA

Specialty Chemicals

INR 123 Cr (Micro Cap)

22.00
37

0.00%

0.28

4.01%

0.92
Total ReturnsTotal Returns (Price + Dividend) 
Polson for the last several years.
Risk Adjusted Returns v/s
Returns Beta
 News & Corporate Actions
News
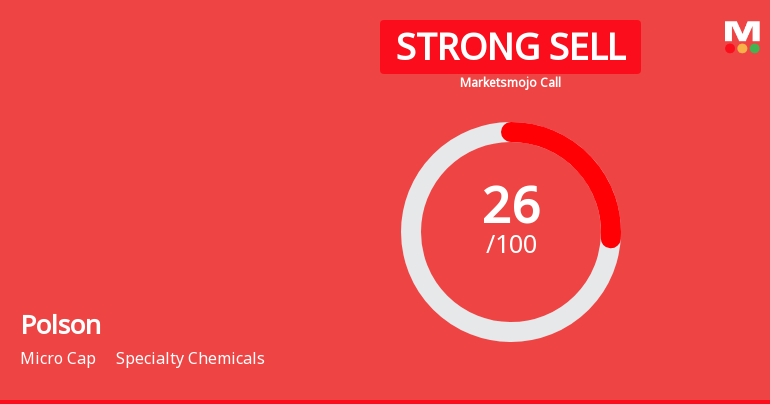
Polson Ltd. is Rated Strong Sell
Polson Ltd. is rated Strong Sell by MarketsMOJO, with this rating last updated on 13 November 2026. However, the analysis and financial metrics discussed here reflect the stock’s current position as of 19 November 2026, providing investors with the most up-to-date view of the company’s performance and outlook.
Read More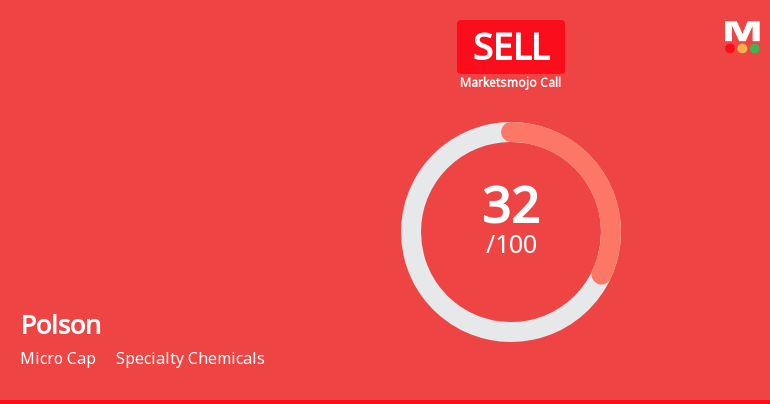
Polson Ltd. is Rated Sell by MarketsMOJO
Polson Ltd. is rated 'Sell' by MarketsMOJO, with this rating last updated on 14 August 2026. However, the analysis and financial metrics discussed here reflect the stock's current position as of 30 October 2026, providing investors with an up-to-date view of the company’s performance and outlook.
Read More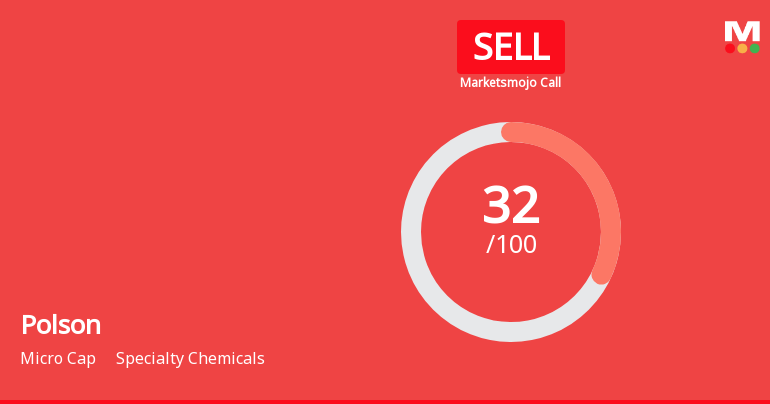
Polson Ltd. is Rated Sell by MarketsMOJO
Polson Ltd. is currently rated Sell by MarketsMOJO, with this rating last updated on 14 August 2026. However, the analysis and financial metrics discussed below reflect the stock's present position as of 19 October 2026, providing investors with the most up-to-date view of the company’s fundamentals, valuation, financial trends, and technical outlook.
Read More Announcements
Disclosure under Regulation 30A of LODR
14-Nov-2026 | Source : BSEPlease find attached newspaper advertisements
Standalone Un-Audited Results For The Quarter And Half Year Ended September 30 2026
13-Nov-2026 | Source : BSEThe Board of Directors of the Company has considered and approved the standalone un-audited results for the quarter and half year ended September 30 2026 along with the Statement of Assets & Liabilities Cash Flow Statement and Limited Review Report
Board Meeting Outcome for Outcome Of Board Meeting
13-Nov-2026 | Source : BSEThe Board has considered and approved the un-audited standalone results for the quarter and half year ended September 30 2026.
Corporate Actions

No Upcoming Board Meetings

No Dividend history available

No Splits history available

No Bonus history available

No Rights history available
Key FactorsQuality key factors
Valuation key factors
Technicals key factors
 Technical Indicator Scale: Bearish, Mildly Bearish, Sideways, Mildly Bullish, Bullish Turned Shareholding
Shareholding Snapshot : Sep 2026
Shareholding Compare (%holding)
Promoters
None
Held by 0 Schemes
Held by 0 FIIs
Aji Commercial Private Limited (53.62%)
None
22.1%
FinancialQuarterly Results Snapshot (Standalone) - Sep'26 - YoY
 Compare with Peers

YoY Growth in quarter ended Sep 2026 is 29.31% vs 1.89% in Sep 2025
YoY Growth in quarter ended Sep 2026 is 21.31% vs 6.09% in Sep 2025

Half Yearly Results Snapshot (Standalone) - Sep'25
Growth in half year ended Sep 2025 is -1.64% vs -11.67% in Sep 2024
Growth in half year ended Sep 2025 is -5.04% vs -20.86% in Sep 2024
Nine Monthly Results Snapshot (Standalone) - Dec'25
YoY Growth in nine months ended Dec 2025 is -1.78% vs -5.21% in Dec 2024
YoY Growth in nine months ended Dec 2025 is -4.44% vs -17.81% in Dec 2024
Annual Results Snapshot (Standalone) - Mar'26
YoY Growth in year ended Mar 2026 is -2.27% vs -3.23% in Mar 2025

YoY Growth in year ended Mar 2026 is -9.37% vs 0.58% in Mar 2025
 Company CV
About Polson Ltd.

Company Coordinates


