
 Score
Dashboard
Weak Long Term Fundamental Strength with an average Return on Capital Employed (ROCE) of 4.63%
- Poor long term growth as Net Sales has grown by an annual rate of 4.22% over the last 5 years
- Low ability to service debt as the company has a high Debt to EBITDA ratio of 8.62 times
The company has declared Positive results for the last 3 consecutive quarters
Stock is technically in a Mildly Bullish range
With ROCE of 7.4, it has a Very Attractive valuation with a 1 Enterprise value to Capital Employed
Majority shareholders : Promoters
Consistent Underperformance against the benchmark over the last 3 years
Mojo ParametersStock DNA

Garments & Apparels

INR 33 Cr (Micro Cap)

7.00
24

0.00%

1.49

13.31%

0.96
Total ReturnsTotal Returns (Price + Dividend) 
Pasupati Spinng. for the last several years.
Risk Adjusted Returns v/s
Returns Beta
 News & Corporate Actions
News
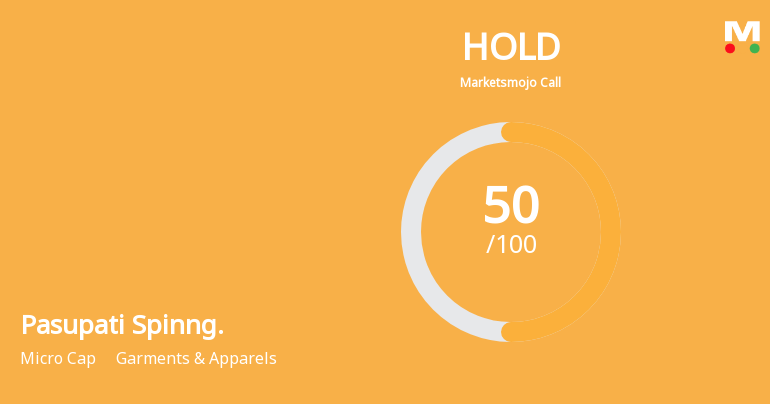
Pasupati Spinning & Weaving Mills Ltd Upgraded to Hold on Improved Technicals and Valuation
Pasupati Spinning & Weaving Mills Ltd has seen its investment rating upgraded from Sell to Hold, reflecting a notable improvement in its technical outlook and valuation metrics. The upgrade, effective from 17 Nov 2026, comes amid a backdrop of positive quarterly financial results and a shift in market sentiment, signalling cautious optimism for this micro-cap player in the garments and apparels sector.
Read More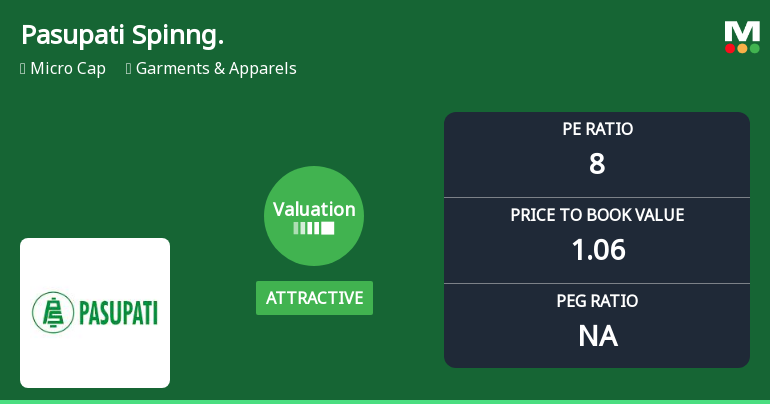
Pasupati Spinning & Weaving Mills Ltd: Valuation Shift Enhances Price Attractiveness
Pasupati Spinning & Weaving Mills Ltd has witnessed a notable shift in its valuation parameters, moving from a very attractive to an attractive grade, reflecting a subtle but meaningful change in market perception. This micro-cap player in the Garments & Apparels sector now presents a more balanced risk-reward profile, supported by its current price-to-earnings (P/E) and price-to-book value (P/BV) ratios relative to historical and peer benchmarks.
Read More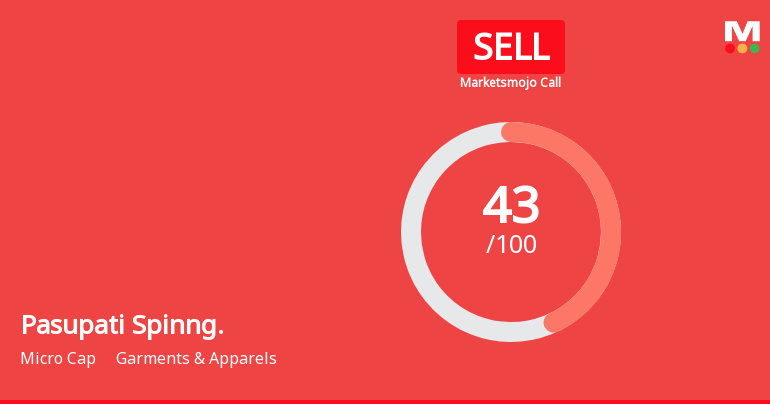
Pasupati Spinning & Weaving Mills Ltd Downgraded to Sell Amid Mixed Financial and Technical Signals
Pasupati Spinning & Weaving Mills Ltd, a micro-cap player in the Garments & Apparels sector, has seen its investment rating downgraded from Hold to Sell by MarketsMOJO as of 12 Nov 2026. The downgrade reflects a combination of deteriorating technical indicators, weak long-term fundamentals, and valuation concerns despite recent positive quarterly results.
Read More Announcements
Announcement under Regulation 30 (LODR)-Newspaper Publication
16-Nov-2026 | Source : BSEPFA herewith newspaper publication for financial results for the period ended 30.09.2026
Board Meeting Outcome for Outcome Of Board Meeting Dated 14/11/2026
14-Nov-2026 | Source : BSEPursuant to Regulation 30 of SEBI (Listing Obligations and Disclosure Requirements) Regulations 2015
Results-Financial Results For 30/09/2026
14-Nov-2026 | Source : BSEPFA herewith results for period ended 30.09.2026
Corporate Actions

No Upcoming Board Meetings

No Dividend history available

Pasupati Spinning & Weaving Mills Ltd has announced 10:4 stock split, ex-date: 15 Mar 12

No Bonus history available

No Rights history available
Key FactorsQuality key factors
Valuation key factors
Technicals key factors
 Technical Indicator Scale: Bearish, Mildly Bearish, Sideways, Mildly Bullish, Bullish Turned Shareholding
Shareholding Snapshot : Sep 2026
Shareholding Compare (%holding)
Promoters
9.9976
Held by 6 Schemes (0.03%)
Held by 0 FIIs
Pasupati Olefin Ltd. (43.57%)
Jm Financial Asset Reconstruction Company Limited (10.71%)
7.58%
FinancialQuarterly Results Snapshot (Standalone) - Sep'26 - QoQ
 Compare with Peers

QoQ Growth in quarter ended Sep 2026 is 10.81% vs -7.80% in Jun 2026

QoQ Growth in quarter ended Sep 2026 is -38.22% vs -11.30% in Jun 2026

Half Yearly Results Snapshot (Standalone) - Sep'25
Growth in half year ended Sep 2025 is -3.93% vs -14.39% in Sep 2024
Growth in half year ended Sep 2025 is 280.00% vs -176.92% in Sep 2024
Nine Monthly Results Snapshot (Standalone) - Dec'25
YoY Growth in nine months ended Dec 2025 is -3.41% vs -10.77% in Dec 2024
YoY Growth in nine months ended Dec 2025 is -10.26% vs 143.75% in Dec 2024
Annual Results Snapshot (Standalone) - Mar'26
YoY Growth in year ended Mar 2026 is -1.15% vs -6.88% in Mar 2025
YoY Growth in year ended Mar 2026 is 152.27% vs 49.15% in Mar 2025
 Company CV
About Pasupati Spinning & Weaving Mills Ltd

Company Coordinates


