
 Score
Dashboard
Weak Long Term Fundamental Strength with an average Return on Capital Employed (ROCE) of 5.68%
- Low ability to service debt as the company has a high Debt to EBITDA ratio of 6.44 times
Positive results in Sep 26
Stock is technically in a Mildly Bearish range
With ROCE of 6.1, it has a Very Attractive valuation with a 0.6 Enterprise value to Capital Employed
Majority shareholders : Promoters
Consistent Underperformance against the benchmark over the last 3 years
Mojo ParametersStock DNA

E-Retail/ E-Commerce

INR 17 Cr (Micro Cap)

7.00
19

0.00%

0.80

3.94%

0.29
Total ReturnsTotal Returns (Price + Dividend) 
Olympia Industri for the last several years.
Risk Adjusted Returns v/s
Returns Beta
 News & Corporate Actions
News
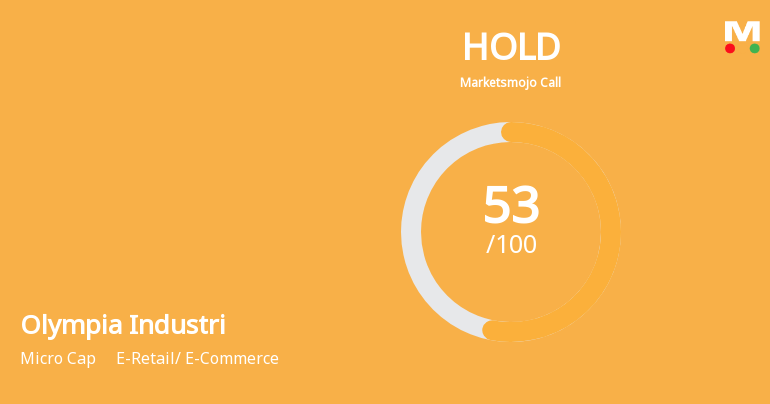
Olympia Industries Ltd Upgraded to Hold as Technicals Improve Amid Mixed Financials
Olympia Industries Ltd, a micro-cap player in the E-Retail and E-Commerce sector, has seen its investment rating upgraded from Sell to Hold as of 19 Nov 2026. This change reflects a nuanced improvement across technical indicators, valuation metrics, and recent financial performance, despite persistent challenges in long-term fundamentals and market returns.
Read More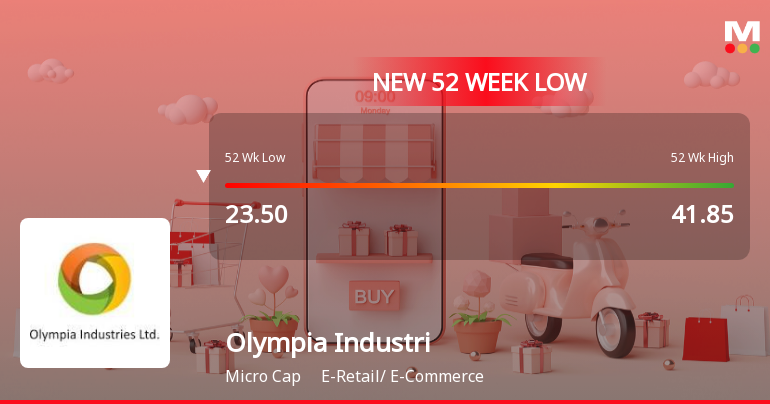
Markets Rally, But Olympia Industries Ltd Sinks to 52-Week Low in Stock-Specific Sell-Off
Despite a broader market rally, Olympia Industries Ltd has slipped to a fresh 52-week low, closing just 2.08% above its lowest price in the past year. The stock’s recent decline contrasts sharply with the wider market movements, underscoring company-specific pressures that have weighed heavily on investor sentiment.
Read More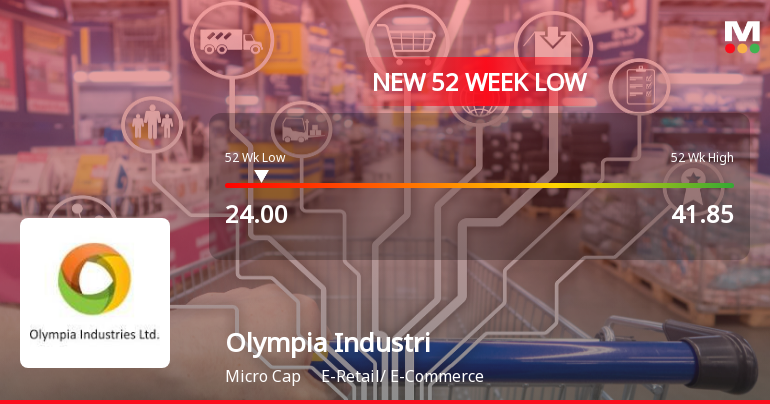
Five Consecutive Losses Push Olympia Industries Ltd to a New 52-Week Low
For the fifth consecutive session, Olympia Industries Ltd has closed lower, culminating in a fresh 52-week low of Rs 24 on 28 Aug 2026. This decline comes despite the broader market showing resilience, with the Sensex gaining 0.24% and several indices hitting new highs.
Read More Announcements
Announcement under Regulation 30 (LODR)-Newspaper Publication
06-Nov-2026 | Source : BSESubmission of copies of newspaper publication pertaining to unaudited financial results for the quarter and half year ended September 30 2026.
Board Meeting Outcome for Outcome Of Board Meeting Held On November 05 2026
05-Nov-2026 | Source : BSEPursuant to Regulations 30 and Regulation 33 of SEBI (Listing Obligations and Disclosure Requirements) Regulations 2015 please find attached herewith the outcome of board meeting held on November 05 2026
Results- Unaudited Financial Results For The Quarter And Half Year Ended September 30 2026.
05-Nov-2026 | Source : BSEUnaudited Financials Results for the quarter and half year ended September 30 2026.
Corporate Actions

No Upcoming Board Meetings

No Dividend history available

No Splits history available

No Bonus history available

No Rights history available
Key FactorsQuality key factors
Valuation key factors
Technicals key factors
 Technical Indicator Scale: Bearish, Mildly Bearish, Sideways, Mildly Bullish, Bullish Turned Shareholding
Shareholding Snapshot : Sep 2026
Shareholding Compare (%holding)
Promoters
4.2241
Held by 3 Schemes (0.05%)
Held by 0 FIIs
Ekamat Bizcom Private Ltd (14.09%)
None
24.13%
FinancialQuarterly Results Snapshot (Standalone) - Sep'26 - QoQ
 Compare with Peers

QoQ Growth in quarter ended Sep 2026 is -15.65% vs 36.25% in Jun 2026
QoQ Growth in quarter ended Sep 2026 is 1.61% vs 47.62% in Jun 2026

Half Yearly Results Snapshot (Standalone) - Sep'25
Growth in half year ended Sep 2025 is 9.26% vs 101.41% in Sep 2024
Growth in half year ended Sep 2025 is 54.84% vs 77.14% in Sep 2024
Nine Monthly Results Snapshot (Standalone) - Dec'25
YoY Growth in nine months ended Dec 2025 is 11.67% vs 59.46% in Dec 2024

YoY Growth in nine months ended Dec 2025 is 52.75% vs 51.67% in Dec 2024
Annual Results Snapshot (Standalone) - Mar'26
YoY Growth in year ended Mar 2026 is 11.43% vs 49.42% in Mar 2025
YoY Growth in year ended Mar 2026 is 38.46% vs 64.56% in Mar 2025
 Company CV
About Olympia Industries Ltd

Company Coordinates


