
 Score
Dashboard
High Management Efficiency with a high ROCE of 16.37%
With a growth in Net Profit of 17.79%, the company declared Very Positive results in Sep 26
Stock is technically in a Bullish range
With ROCE of 11.8, it has a Expensive valuation with a 2 Enterprise value to Capital Employed
Majority shareholders : Promoters
Market Beating performance in long term as well as near term
Mojo ParametersStock DNA

Garments & Apparels

INR 3,960 Cr (Small Cap)

15.00
24

0.43%

0.76

18.07%

2.66
Total ReturnsTotal Returns (Price + Dividend) 
Latest dividend: 3.0016129032258068 per share ex-dividend date: Sep-11-2026
Risk Adjusted Returns v/s
Returns Beta
 News & Corporate Actions
News
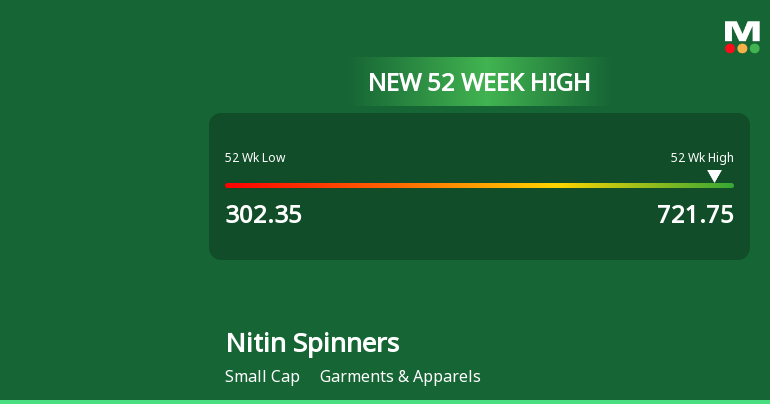
Broad-Based Technical Strength Lifts Nitin Spinners Ltd to 52-Week High of Rs 721.75
Surging past its previous peaks, Nitin Spinners Ltd touched an all-time high of Rs 721.75 on 20 Nov 2026, marking a remarkable 109.62% gain over the past year. This milestone comes amid a backdrop of strong technical momentum that has propelled the stock well beyond its 52-week low of Rs 302.35, even as the broader Sensex trades modestly below its own yearly highs.
Read More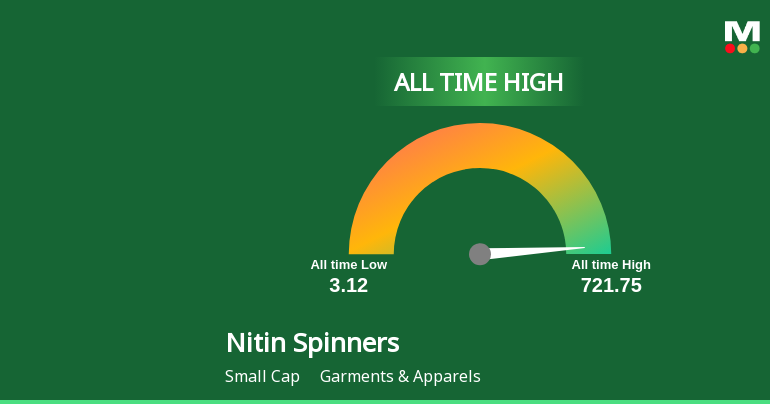
Nitin Spinners Ltd Hits All-Time High of Rs 721.75 as Momentum Builds Across Timeframes
Extending its recent rally, Nitin Spinners Ltd surged to a fresh all-time high of Rs 721.75 on 20 Nov 2026, marking a significant milestone in its price journey. The stock outperformed its sector and the broader market, reflecting strong momentum across multiple timeframes.
Read More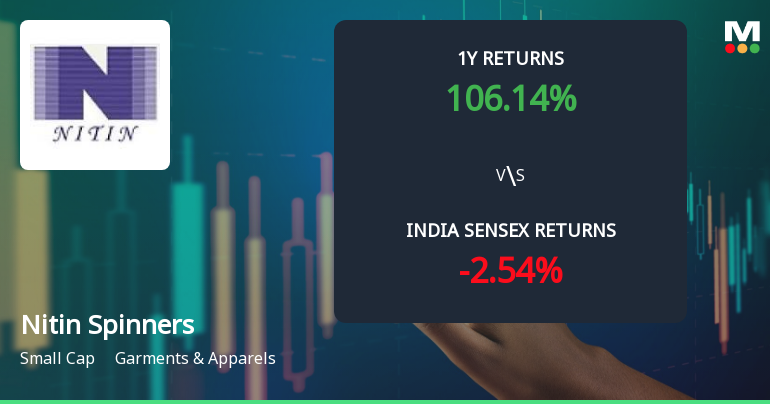
Nitin Spinners Ltd Technical Momentum Shifts Signal Bullish Outlook Amid Market Volatility
Nitin Spinners Ltd has exhibited a notable shift in its technical momentum, moving from a mildly bullish stance to a more confident bullish trend. This transition is underscored by a confluence of positive signals from key technical indicators such as MACD, moving averages, and Bollinger Bands, despite some mixed readings from the RSI and KST. The stock’s recent performance, coupled with its technical upgrades, suggests a strengthening price momentum that investors should carefully analyse in the context of broader market dynamics.
Read More Announcements
TRANSCRIPT OF ANALYST/ INVESTOR EARNINGS CALL HELD ON 02.11.2026
06-Nov-2026 | Source : BSETRANSCRIPT OF ANALYST/INVESTOR EARNING CALL HELD ON 02.11.2026
Announcement under Regulation 30 (LODR)-Newspaper Publication
02-Nov-2026 | Source : BSESUBMISSION OF COPY OF NEWSPAPER ADVERTISEMENT IN RESPECT OF UNAUDITED FINANCIAL RESULTS FOR THE QUARTER AND HALF YEAR ENDED 30TH SEPTEMBER 2026
Board Meeting Outcome for UN-AUDITED FINANCIAL RESULTS FOR THE QUARTER AND HALF YEAR ENDED 30.09.2026
31-Oct-2026 | Source : BSEUN-AUDITED FINANCIAL RESULTS FOR THE QUARTER AND HALF YEAR ENDED 30.09.2026
Corporate Actions

No Upcoming Board Meetings

Nitin Spinners Ltd has declared 30% dividend, ex-date: 11 Sep 26

No Splits history available

No Bonus history available

No Rights history available
Key FactorsQuality key factors
Valuation key factors
Technicals key factors
 Technical Indicator Scale: Bearish, Mildly Bearish, Sideways, Mildly Bullish, Bullish Turned Shareholding
Shareholding Snapshot : Sep 2026
Shareholding Compare (%holding)
Promoters
None
Held by 5 Schemes (14.57%)
Held by 58 FIIs (1.95%)
Redial Trading And Investment Private Limited (32.18%)
Bandhan Small Cap Fund (5.3%)
21.01%
FinancialQuarterly Results Snapshot (Standalone) - Sep'26 - QoQ
 Compare with Peers

QoQ Growth in quarter ended Sep 2026 is 12.58% vs 1.77% in Jun 2026

QoQ Growth in quarter ended Sep 2026 is 17.79% vs 31.22% in Jun 2026

Half Yearly Results Snapshot (Standalone) - Sep'25
Growth in half year ended Sep 2025 is -4.43% vs 20.01% in Sep 2024
Growth in half year ended Sep 2025 is -10.10% vs 39.08% in Sep 2024
Nine Monthly Results Snapshot (Standalone) - Dec'25
YoY Growth in nine months ended Dec 2025 is -4.47% vs 17.08% in Dec 2024
YoY Growth in nine months ended Dec 2025 is -6.88% vs 39.75% in Dec 2024
Annual Results Snapshot (Standalone) - Mar'26
YoY Growth in year ended Mar 2026 is -2.78% vs 13.77% in Mar 2025
YoY Growth in year ended Mar 2026 is 1.21% vs 33.39% in Mar 2025
 Company CV
About Nitin Spinners Ltd

Company Coordinates


