
 Score
Dashboard
Poor Management Efficiency with a low ROE of 8.99%
- The company has been able to generate a Return on Equity (avg) of 8.99% signifying low profitability per unit of shareholders funds
- PAT(Q) At Rs 5.90 cr has Fallen at -24.3% (vs previous 4Q average)
- ROCE(HY) Lowest at 14.38%
- OPERATING PROFIT TO INTEREST (Q) Lowest at 1.55 times
Stock is technically in a Bearish range
Reducing Promoter Confidence
Underperformed the market in the last 1 year


 Total Returns
 (Price + Dividend) 
Nila Spaces for the last several years.
Risk Adjusted Returns v/s
Returns Beta
 News & Corporate Actions
News
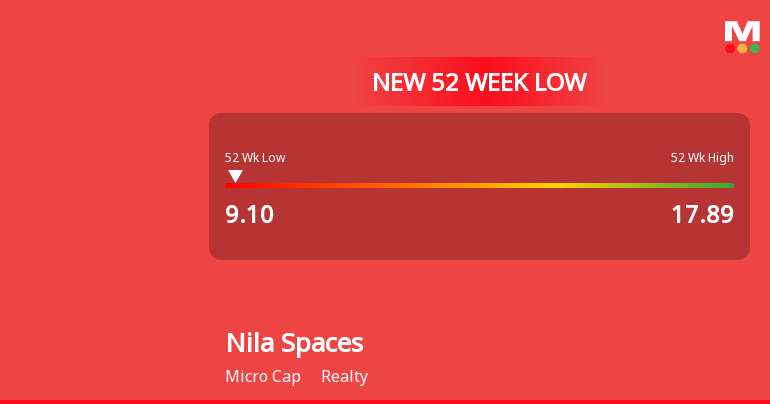
Nila Spaces Ltd Falls to 52-Week Low of Rs 9.1 as Sell-Off Deepens
For the fourth consecutive session, Nila Spaces Ltd has closed lower, hitting a fresh 52-week low of Rs 9.1 on 17 Nov 2026, marking a 7.36% decline over this losing streak and underperforming its sector by 1.03% today.
Read More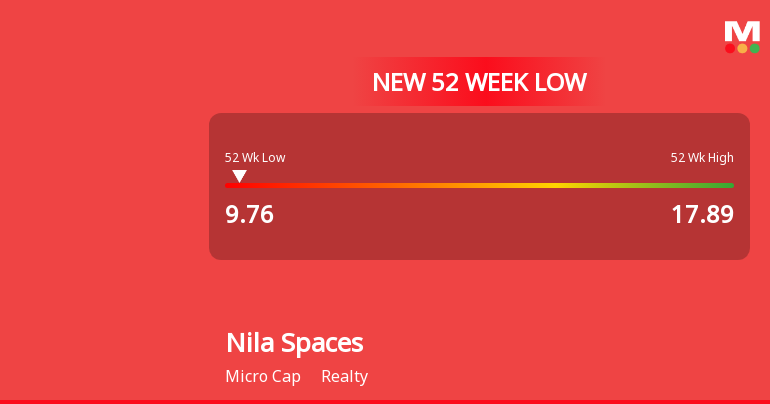
Nila Spaces Ltd Falls to 52-Week Low of Rs 9.76 Amidst Profit and Sales Decline
A 1.29% drop over the last two sessions has pushed Nila Spaces Ltd to a fresh 52-week low of Rs 9.76 on 13 Nov 2026, marking a 45.5% decline from its 52-week high of Rs 17.89. This decline comes despite some positive long-term growth indicators, highlighting a complex interplay of factors weighing on the stock.
Read More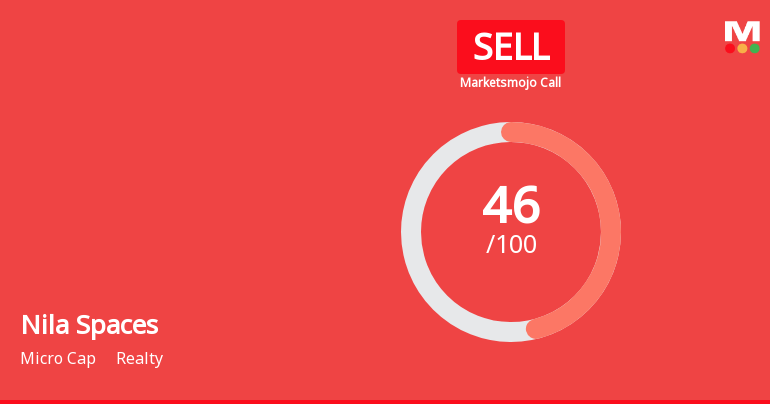
Nila Spaces Ltd is Rated Sell by MarketsMOJO
Nila Spaces Ltd is rated Sell by MarketsMOJO, with this rating last updated on 13 May 2026. However, the analysis and financial metrics discussed here reflect the stock's current position as of 26 October 2026, providing investors with an up-to-date view of the company’s fundamentals, returns, and market standing.
Read More Announcements
Announcement under Regulation 30 (LODR)-Newspaper Publication
31-Oct-2026 | Source : BSECopy of Newspaper Advertisement.
Board Meeting Outcome for Outcome Of Board Meeting
30-Oct-2026 | Source : BSEOutcome of Board Meeting
Financial Results For The Quarter Ended September 30 2026.
30-Oct-2026 | Source : BSEFinancial Results for the quarter ended September 30 2026.
Corporate Actions

No Upcoming Board Meetings

No Dividend history available

No Splits history available

No Bonus history available

No Rights history available
Key FactorsQuality key factors
Valuation key factors
Technicals key factors
 Technical Indicator Scale: Bearish, Mildly Bearish, Sideways, Mildly Bullish, Bullish Turned Shareholding
Shareholding Snapshot : Sep 2026
Shareholding Compare (%holding)
Promoters
None
Held by 0 Schemes
Held by 2 FIIs (0.0%)
Manoj B Vadodaria (11.76%)
Shobha Imtiyaz Desai (1.07%)
33.26%
FinancialQuarterly Results Snapshot (Consolidated) - Sep'26 - QoQ
 Compare with Peers

QoQ Growth in quarter ended Sep 2026 is -18.19% vs -6.29% in Jun 2026
QoQ Growth in quarter ended Sep 2026 is -30.34% vs -7.93% in Jun 2026

Half Yearly Results Snapshot (Consolidated) - Sep'25

Growth in half year ended Sep 2025 is 31.76% vs 0.00% in Sep 2024
Growth in half year ended Sep 2025 is 80.83% vs 1,705.13% in Sep 2024
Nine Monthly Results Snapshot (Consolidated) - Dec'25
YoY Growth in nine months ended Dec 2025 is 40.81% vs 64.38% in Dec 2024
YoY Growth in nine months ended Dec 2025 is 93.41% vs -10.94% in Dec 2024
Annual Results Snapshot (Consolidated) - Mar'26
YoY Growth in year ended Mar 2026 is 36.24% vs 49.71% in Mar 2025
YoY Growth in year ended Mar 2026 is 93.75% vs 9.76% in Mar 2025
 Company CV
About Nila Spaces Ltd

Company Coordinates


