
 News and Views
Kalyani Investment Company Gains 2.43%: 2 Key Factors Driving the Week
2026-11-14 17:03:13Key Events This Week Nov 09: Stock opens strong at Rs.4,480.00 (+3.08%) Nov 11: Technical analysis signals bearish momentum Nov 12: Very positive quarterly financial results announced Nov 13: Week closes at Rs.4,452.05 (+2.43% weekly gain) Week OpenRs.4,346.25 Week CloseRs.4,452.05<div cl...
Read More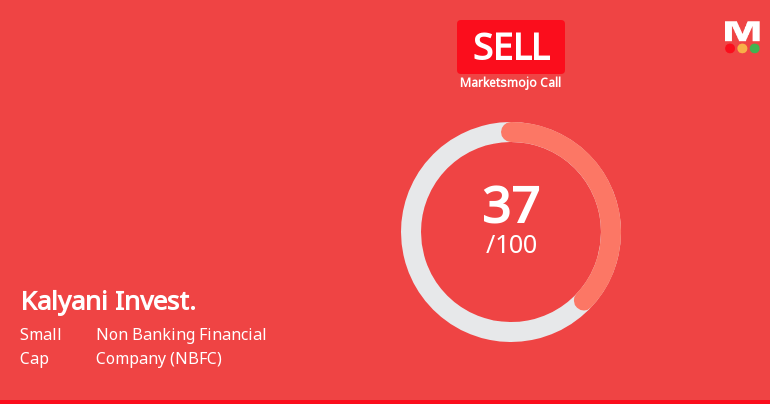
Kalyani Investment Company Ltd is Rated Sell
2026-11-14 10:10:04Kalyani Investment Company Ltd is rated 'Sell' by MarketsMOJO, with this rating last updated on 04 Nov 2026. However, the analysis and financial metrics discussed here reflect the stock's current position as of 14 November 2026, providing investors with the latest insights into the company’s performance and outlook.
Read MoreKalyani Investment Company Ltd Falls 1.46%: Bearish Momentum and Technical Warnings Dominate Week
2026-10-31 17:04:03Key Events This Week 26 Oct: Stock opens at Rs.4,419.10, modest gain of 0.19% 27 Oct: Sharp decline of 1.45% to Rs.4,355.00 amid broader market gains 28 Oct: Death Cross confirmed; stock rallies 2.82% to Rs.4,478.00 29 Oct: Bearish momentum intensifies; stock falls 2.94% to Rs.4,346.25 30 Oct: Week closes flat at Rs.4,346.25 with Sensex retreating 0.30% Week Open<div class="stat-va...
Read More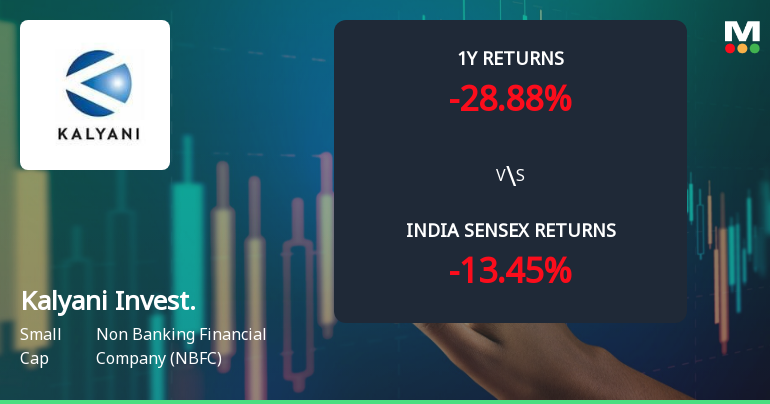
Kalyani Investment Company Ltd Faces Bearish Momentum Amid Mixed Technical Signals
2026-10-29 08:01:21Kalyani Investment Company Ltd, a small-cap player in the Non Banking Financial Company (NBFC) sector, has seen a notable shift in its technical momentum, with recent indicators signalling a bearish trend despite some bullish undertones. The stock’s current price stands at ₹4,478, reflecting a 2.82% rise on the day, yet the broader technical landscape suggests caution for investors as momentum indicators and moving averages point to a deteriorating outlook.
Read More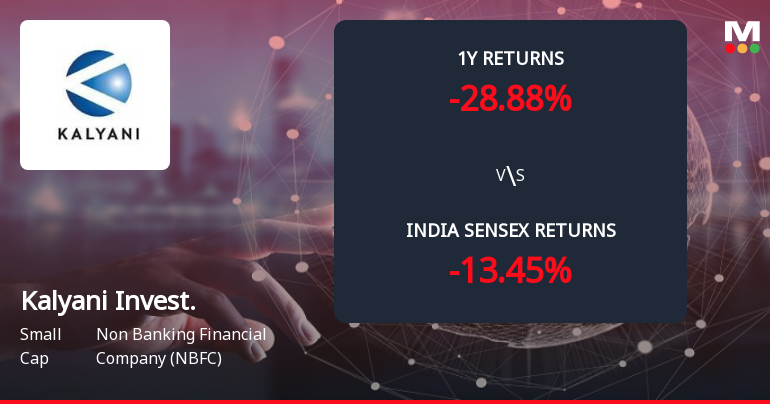
Kalyani Investment Company Ltd Forms Death Cross, Signalling Bearish Trend
2026-10-28 18:00:47Kalyani Investment Company Ltd has recently formed a Death Cross, a significant technical indicator where the 50-day moving average (DMA) crosses below the 200-day moving average. This development signals a potential shift towards a bearish trend, reflecting deteriorating momentum and long-term weakness in the stock’s price action.
Read More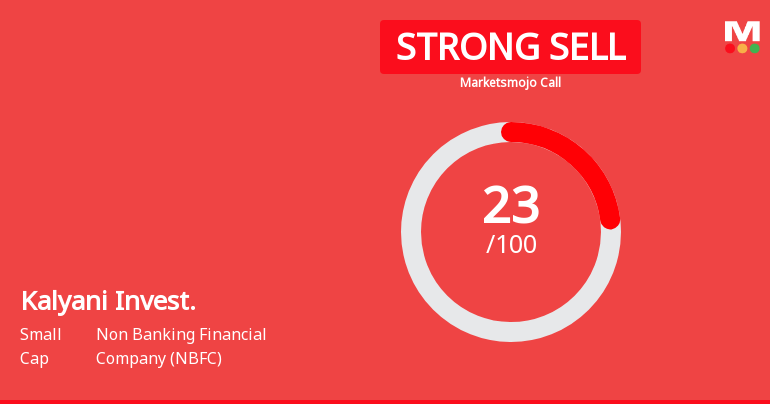
Kalyani Investment Company Ltd is Rated Strong Sell
2026-10-23 10:10:18Kalyani Investment Company Ltd is rated Strong Sell by MarketsMOJO, with this rating last updated on 30 September 2026. However, the analysis and financial metrics discussed here reflect the stock's current position as of 23 October 2026, providing investors with the most up-to-date view of the company’s fundamentals, valuation, financial trends, and technical outlook.
Read More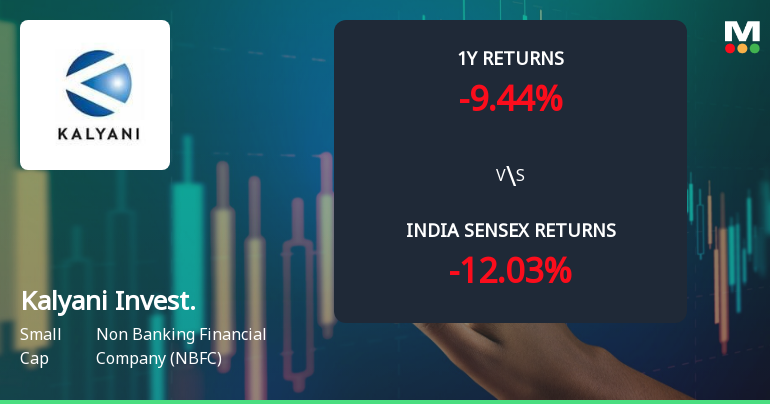
Kalyani Investment Company Ltd Faces Mildly Bearish Technical Shift Amidst Mixed Momentum Signals
2026-10-21 08:03:39Kalyani Investment Company Ltd, a small-cap player in the Non Banking Financial Company (NBFC) sector, has experienced a subtle shift in its technical momentum, moving from a sideways trend to a mildly bearish stance. Recent technical indicators, including MACD, RSI, and moving averages, reveal a nuanced picture of the stock’s near-term prospects amid a challenging market environment.
Read More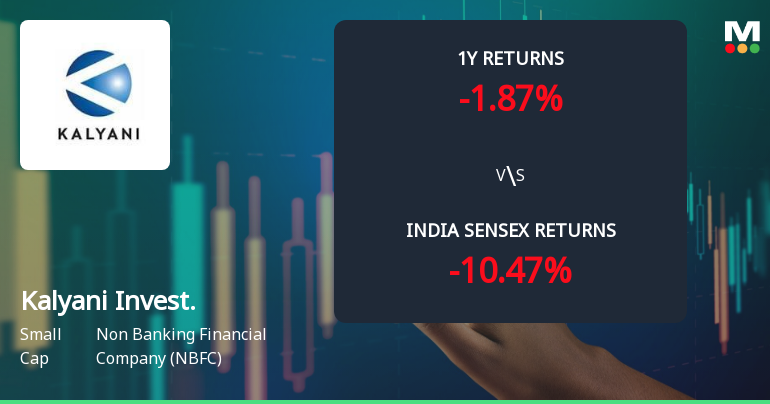
Kalyani Investment Company Ltd Technical Momentum Shifts Amid Mixed Indicators
2026-10-19 08:01:50Kalyani Investment Company Ltd, a small-cap player in the Non Banking Financial Company (NBFC) sector, has witnessed a notable shift in its technical momentum, moving from a mildly bearish stance to a sideways trend. Despite a recent day gain of 3.76%, the stock’s technical indicators present a complex picture, with mixed signals from MACD, RSI, Bollinger Bands, and moving averages, reflecting cautious investor sentiment amid broader market fluctuations.
Read More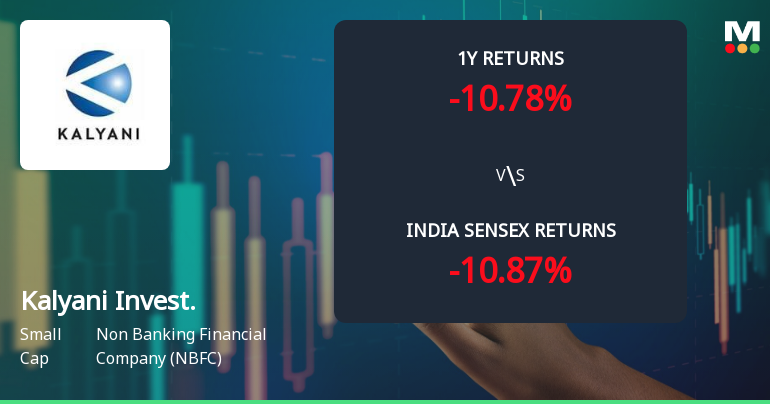
Kalyani Investment Company Ltd Technical Analysis: Momentum Shifts Amid Bearish Signals
2026-10-06 08:03:17Kalyani Investment Company Ltd, a small-cap player in the Non Banking Financial Company (NBFC) sector, has experienced a notable shift in its technical momentum, moving from a sideways trend to a mildly bearish stance. Despite a modest day gain of 0.25%, key technical indicators such as MACD, Bollinger Bands, and KST suggest caution for investors, while some moving averages and RSI readings offer limited bullish signals. This comprehensive analysis delves into the evolving technical landscape and what it means for the stock’s near-term outlook.
Read More Announcement
 under Regulation 30 (LODR)-Newspaper Publication
05-Nov-2026 | Source : BSEAnnouncement under Regulation 30 of SEBI (LODR) - Newspaper Publication - Unaudited Results Q2
Determination Of Materiality - KMP Contact Details
04-Nov-2026 | Source : BSEAnnouncement U/R 30 of SEBI LODR - Determination of Materiality - KMP Contact Details.
Statement Of Unaudited Financial Results (Standalone And Consolidated) For The Quarter And Half Year Ended September 30 2026
04-Nov-2026 | Source : BSEStatement Of Unaudited Financial Results (Standalone And Consolidated) For the Quarter and Half Year Ended September 30 2026
Corporate ActionsCorporate Actions


No Upcoming Board Meetings

Kalyani Investment Company Ltd has declared 100% dividend, ex-date: 14 Aug 26

No Splits history available

No Bonus history available

No Rights history available
