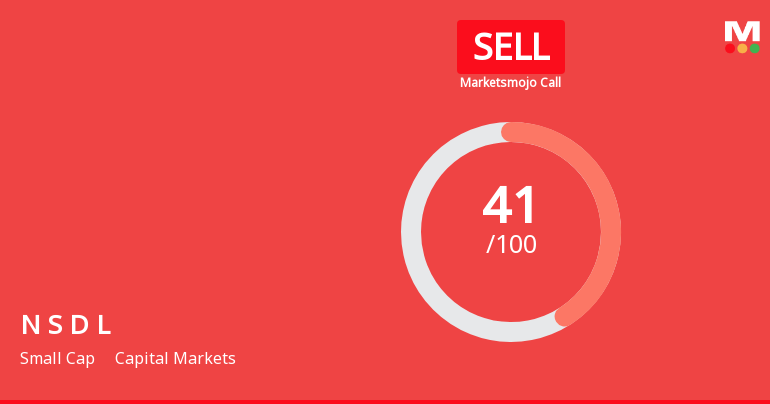
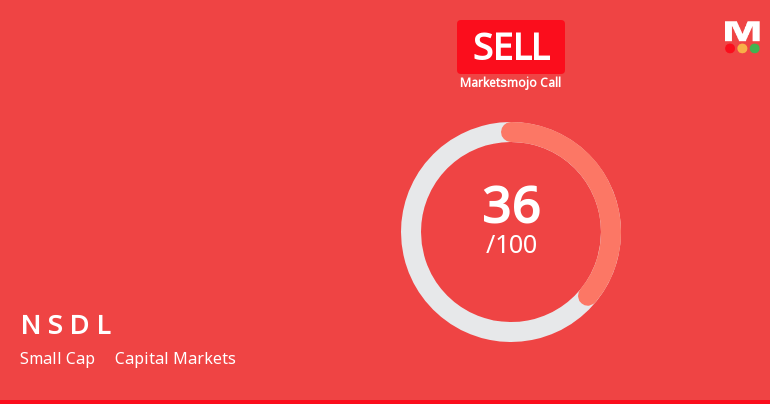
N S D L

  • Market Cap: Small Cap
  • Industry: Capital Markets
  • ISIN: INE301O01023
  • NSEID:
  • BSEID: 544467
INR
795.55
-10.1 (-1.25%)
BSENSE

Nov 20

BSE+NSE Vol: 410932

  • Price Points
  • Score
  • Mojo Parameters
  • Total Return
  • News and Corporate Actions
  • Key factors
  • Shareholding
  • Financials
  • CompanyCV
stock-summaryPrice Point
High/Low

1Day

52 Week

Valuation
Technical
Day's Volume

CASH

4.11 lacs (-29.08%) Volume

Shareholding (Sep 2026)

FII

5.75%

Held by 65 FIIs

DII

40.67%

Held by 20 DIIs

Promoter

0.00%

Is N S D L overvalued or undervalued?

01-Sep-2025

As of August 29, 2025, N S D L is considered very expensive and overvalued with a PE ratio of 72.17, significantly higher than its peers, and has underperformed the market with a 2.92% decline compared to the Sensex's 1.84% drop.

As of 29 August 2025, the valuation grade for N S D L has moved from does not qualify to very expensive, indicating a significant shift in its perceived value. The company is currently overvalued, with a PE ratio of 72.17, an EV to EBITDA of 63.13, and an EV to Sales ratio of 16.69. These ratios are substantially higher than those of its peers, such as Bajaj Finance with a PE of 31.3 and Bajaj Finserv at 32.09, both of which are also categorized as expensive but remain significantly lower than N S D L.<BR><BR>In comparison to the broader market, N S D L's recent performance shows a decline of 2.92% over the past week, while the Sensex has only decreased by 1.84%. This underperformance, coupled with high valuation ratios, reinforces the conclusion that N S D L is overvalued in the current market environment.

Read More

How has been the historical performance of N S D L?

13-Nov-2025

N S D L has shown significant growth from Mar'22 to Mar'25, with net sales increasing from 761.11 Cr to 1,420.15 Cr, and profit after tax rising from 214.00 Cr to 340.72 Cr, alongside substantial improvements in total assets and cash flow. Overall, the company has demonstrated robust financial performance across key metrics.

Answer:<BR>The historical performance of N S D L shows significant growth in key financial metrics over the past few years.<BR><BR>Breakdown:<BR>N S D L's net sales have increased from 761.11 Cr in Mar'22 to 1,420.15 Cr in Mar'25, indicating a strong upward trend. Total operating income has mirrored this growth, rising from 761.11 Cr in Mar'22 to 1,420.15 Cr in Mar'25. The company's total expenditure, excluding depreciation, also grew from 520.58 Cr in Mar'22 to 1,044.64 Cr in Mar'25, while operating profit (PBDIT) improved from 300.71 Cr in Mar'22 to 490.55 Cr in Mar'25. Profit before tax has seen a similar increase, moving from 279.61 Cr in Mar'22 to 451.04 Cr in Mar'25, and profit after tax rose from 214.00 Cr to 340.72 Cr in the same period. The consolidated net profit reached 343.12 Cr in Mar'25, up from 212.59 Cr in Mar'22. The company's total assets have expanded significantly from 1,686.03 Cr in Mar'22 to 2,980.77 Cr in Mar'25, while total liabilities increased from 1,686.03 Cr to 2,980.77 Cr. Cash flow from operating activities improved from 147.00 Cr in Mar'22 to 557.00 Cr in Mar'25, contributing to a closing cash and cash equivalent of 145.00 Cr in Mar'25, up from 144.00 Cr in Mar'22. Overall, N S D L has demonstrated robust growth across its financial metrics over the past few years.

Read More

Which are the latest news on N S D L?

03-Dec-2025

Why is N S D L falling/rising?

04-Dec-2025

As of 03-Dec, the stock price of National Securities Depository Ltd (NSDL) is declining, currently at 1,079.50, reflecting a 0.96% drop. This trend is supported by decreased investor participation and the stock trading below its moving averages, indicating a bearish outlook.

As of 03-Dec, the stock price of National Securities Depository Ltd (NSDL) is falling, currently at 1,079.50, which reflects a decrease of 10.5 points or 0.96%. This decline is part of a broader trend, as the stock has been losing value for the past five days, resulting in a total drop of 4.65% over that period. <BR><BR>Additionally, NSDL is trading below its moving averages across various time frames, including the 5-day, 20-day, 50-day, 100-day, and 200-day averages, indicating a bearish trend. Investor participation has also decreased, with the delivery volume on December 2 falling by 0.88% compared to the 5-day average. This decline in trading activity suggests a lack of confidence among investors, contributing to the stock's downward movement. Overall, these factors collectively explain the current fall in NSDL's stock price.

Read More
iScoreScore
Click here to find our call on this stock
Strong Sell
Sell
Hold
Buy
Strong Buy
Dashboard
1

Stock is technically in a Mildly Bearish range

  • Multiple factors for the stock are Bearish like RSI, KST and DOW
2

With ROE of 15.9, it has a Very Expensive valuation with a 6.3 Price to Book Value

3

Underperformed the market in the last 1 year

stock-summaryMojo Parameters
Mojo Parameters
Loading Valuation Snapshot...
Stock DNA
stock-summary
Industry

Capital Markets

stock-summary
Market cap

INR 16,022 Cr (Small Cap)

stock-summary
P/E

40.00

stock-summary
Industry P/E

20

stock-summary
Dividend Yield

0.50%

stock-summary
Debt Equity

0.01

stock-summary
Return on Equity

15.94%

stock-summary
Price to Book

6.42

Revenue and Profits:
Net Sales:
546 Cr
(Quarterly Results - Sep 2026)
Net Profit:
122 Cr
stock-summaryTotal Returns
Total Returns (Price + Dividend) stock-summary
Dividend Yield (0.5%)
TimePeriod
Price Return
Dividend Return
Total Return
3 Months
-1.81%
0%
-1.81%
6 Months
-2.27%
0%
-2.27%
1 Year
-31.06%
0%
-31.06%
2 Years
0%
0%
0.0%
3 Years
0%
0%
0.0%
4 Years
0%
0%
0.0%
5 Years
0%
0%
0.0%

Latest dividend: 2 per share ex-dividend date: Sep-19-2025

Risk Adjusted Returns v/s stock-summary
Returns Beta
Icon
Beta has not been calculated since enough price history is not available
stock-summaryNews & Corporate Actions
News

National Securities Depository Ltd Falls 0.60%: 2 Key Events Mark a Challenging Week

Announcements stock-summary

Announcement under Regulation 30 (LODR)-Analyst / Investor Meet - Intimation

18-Nov-2026 | Source : BSE

Intimation regarding Analyst/Investor Meetings dated November 26 2026

Announcement under Regulation 30 (LODR)-Analyst / Investor Meet - Intimation

12-Nov-2026 | Source : BSE

Intimation regarding Analyst/Investor Meetings dated November 17 2026

Announcement under Regulation 30 (LODR)-Earnings Call Transcript

04-Nov-2026 | Source : BSE

Earnings Call transcript

Corporate Actions stock-summary
stock-summary
BOARD MEETING

No Upcoming Board Meetings

stock-summary
DIVIDEND

National Securities Depository Ltd has declared 200% dividend, ex-date: 11 Sep 26

stock-summary
SPLITS

No Splits history available

stock-summary
BONUS

No Bonus history available

stock-summary
RIGHTS

No Rights history available

stock-summaryKey Factors
Quality key factors stock-summary
Factor
Value
Sales Growth (5y)
19.10%
EBIT Growth (5y)
16.36%
Net Debt to Equity (avg)
0.01
Institutional Holding
46.42%
ROE (avg)
15.94%
Valuation key factors
Factor
Value
P/E Ratio
40
Industry P/E
20
Price to Book Value
6.34
EV to EBIT
35.53
EV to EBITDA
31.09
EV to Capital Employed
19.35
EV to Sales
7.52
PEG Ratio
NA
Dividend Yield
0.50%
ROCE (Latest)
54.46%
ROE (Latest)
15.94%
Technicals key factors
Indicator
Weekly
Monthly
MACD
Mildly Bullish
RSI
Bearish
No Signal
Bollinger Bands
Mildly Bullish
Moving Averages
Mildly Bearish (Daily)
KST
Bearish
Dow Theory
No Trend
Bearish
OBV
No Trend
Mildly Bearish
stock-summary Technical Indicator Scale: Bearish, Mildly Bearish, Sideways, Mildly Bullish, Bullish  Turned 
stock-summaryShareholding
Shareholding Snapshot : Sep 2026stock-summary
Shareholding Compare (%holding) stock-summary
Majority shareholders

Non Institution

Pledged Promoter Holdings

None

Mutual Funds

Held by 7 Schemes (0.46%)

FIIs

Held by 65 FIIs (5.75%)

Promoter with highest holding

None

Highest Public shareholder

National Stock Exchange Of India Limited (15%)

Individual Investors Holdings

33.08%

stock-summaryFinancial
[
  {
    "link": "quarterly",
    "btn_text": "All Quarterly Results",
    "header": "Quarterly Results Snapshot (Consolidated) - Sep'26 - QoQ",
    "rhs": [
      {
        "prefix": "Net Sales ",
        "suffix": "QoQ Growth in quarter ended Sep 2026 is 5.66% vs 12.74% in Jun 2026",
        "dir": -1
      },
      {
        "prefix": "Consolidated Net Profit ",
        "suffix": "QoQ Growth in quarter ended Sep 2026 is 24.47% vs 8.97% in Jun 2026",
        "dir": 1
      }
    ],
    "table": {
      "header": [
        "Sep'26",
        "Jun'26",
        "Change(%)"
      ],
      "body": [
        {
          "field": "Net Sales",
          "val1": "545.89",
          "val2": "516.63",
          "chgp": "5.66%",
          "chgp_class": "positive"
        },
        {
          "field": "Operating Profit (PBDIT) excl Other Income",
          "val1": "142.30",
          "val2": "100.97",
          "chgp": "40.93%",
          "chgp_class": "positive"
        },
        {
          "field": "Interest",
          "val1": "1.71",
          "val2": "1.70",
          "chgp": "0.59%",
          "chgp_class": "negative"
        },
        {
          "field": "Exceptional Items",
          "val1": "0.00",
          "val2": "0.00",
          "chgp": "",
          "chgp_class": "neutral"
        },
        {
          "field": "Consolidate Net Profit",
          "val1": "122.22",
          "val2": "98.19",
          "chgp": "24.47%",
          "chgp_class": "positive"
        },
        {
          "field": "Operating Profit Margin (Excl OI)",
          "val1": "26.07%",
          "val2": "19.54%",
          "chgp": "6.53%",
          "chgp_class": "positive"
        }
      ]
    }
  },
  {
    "link": "half-yearly",
    "btn_text": "All Half Yearly Results",
    "header": "Half Yearly Results Snapshot (Standalone) - Sep'25",
    "rhs": [
      {
        "prefix": "Net Sales ",
        "suffix": "Not Applicable: The company has declared_date for only one period",
        "dir": 0
      },
      {
        "prefix": "Standalone Net Profit ",
        "suffix": "Not Applicable: The company has declared_date for only one period",
        "dir": 0
      }
    ],
    "table": {
      "header": [
        "Sep'25",
        "Sep'24",
        "Change(%)"
      ],
      "body": [
        {
          "field": "Net Sales",
          "val1": "365.12",
          "val2": "303.80",
          "chgp": "20.18%",
          "chgp_class": "positive"
        },
        {
          "field": "Operating Profit (PBDIT) excl Other Income",
          "val1": "200.05",
          "val2": "166.86",
          "chgp": "19.89%",
          "chgp_class": "positive"
        },
        {
          "field": "Interest",
          "val1": "0.05",
          "val2": "0.04",
          "chgp": "25.00%",
          "chgp_class": "negative"
        },
        {
          "field": "Exceptional Items",
          "val1": "0.00",
          "val2": "0.00",
          "chgp": "",
          "chgp_class": "neutral"
        },
        {
          "field": "Standalone Net Profit",
          "val1": "203.04",
          "val2": "168.38",
          "chgp": "20.58%",
          "chgp_class": "positive"
        },
        {
          "field": "Operating Profit Margin (Excl OI)",
          "val1": "54.79%",
          "val2": "54.92%",
          "chgp": "-0.13%",
          "chgp_class": "negative"
        }
      ]
    }
  },
  {
    "link": "nine-monthly",
    "btn_text": "All Nine Monthly Results",
    "header": "Nine Monthly Results Snapshot (Standalone) - Dec'25",
    "rhs": [
      {
        "prefix": "Net Sales ",
        "suffix": "Not Applicable: The company has declared_date for only one period",
        "dir": 0
      },
      {
        "prefix": "Standalone Net Profit ",
        "suffix": "Not Applicable: The company has declared_date for only one period",
        "dir": 0
      }
    ],
    "table": {
      "header": [
        "Dec'25",
        "Dec'24",
        "Change(%)"
      ],
      "body": [
        {
          "field": "Net Sales",
          "val1": "534.11",
          "val2": "452.09",
          "chgp": "18.14%",
          "chgp_class": "positive"
        },
        {
          "field": "Operating Profit (PBDIT) excl Other Income",
          "val1": "290.53",
          "val2": "247.68",
          "chgp": "17.30%",
          "chgp_class": "positive"
        },
        {
          "field": "Interest",
          "val1": "0.09",
          "val2": "0.06",
          "chgp": "50.00%",
          "chgp_class": "negative"
        },
        {
          "field": "Exceptional Items",
          "val1": "0.00",
          "val2": "0.00",
          "chgp": "",
          "chgp_class": "neutral"
        },
        {
          "field": "Standalone Net Profit",
          "val1": "280.92",
          "val2": "245.86",
          "chgp": "14.26%",
          "chgp_class": "positive"
        },
        {
          "field": "Operating Profit Margin (Excl OI)",
          "val1": "54.40%",
          "val2": "54.79%",
          "chgp": "-0.39%",
          "chgp_class": "negative"
        }
      ]
    }
  },
  {
    "link": "annual",
    "btn_text": "All Annual Results",
    "header": "Annual Results Snapshot (Consolidated) - Mar'26",
    "rhs": [
      {
        "prefix": "Net Sales ",
        "suffix": "YoY Growth in year ended Mar 2026 is 7.73% vs 11.98% in Mar 2025",
        "dir": -1
      },
      {
        "prefix": "Consolidated Net Profit ",
        "suffix": "YoY Growth in year ended Mar 2026 is 10.67% vs 24.57% in Mar 2025",
        "dir": -1
      }
    ],
    "table": {
      "header": [
        "Mar'26",
        "Mar'25",
        "Change(%)"
      ],
      "body": [
        {
          "field": "Net Sales",
          "val1": "1,529.96",
          "val2": "1,420.21",
          "chgp": "7.73%",
          "chgp_class": "positive"
        },
        {
          "field": "Operating Profit (PBDIT) excl Other Income",
          "val1": "434.40",
          "val2": "375.49",
          "chgp": "15.69%",
          "chgp_class": "positive"
        },
        {
          "field": "Interest",
          "val1": "6.70",
          "val2": "4.02",
          "chgp": "66.67%",
          "chgp_class": "negative"
        },
        {
          "field": "Exceptional Items",
          "val1": "0.00",
          "val2": "0.00",
          "chgp": "",
          "chgp_class": "neutral"
        },
        {
          "field": "Consolidate Net Profit",
          "val1": "379.74",
          "val2": "343.12",
          "chgp": "10.67%",
          "chgp_class": "positive"
        },
        {
          "field": "Operating Profit Margin (Excl OI)",
          "val1": "28.39%",
          "val2": "26.44%",
          "chgp": "1.95%",
          "chgp_class": "positive"
        }
      ]
    }
  }
]
Quarterly Results Snapshot (Consolidated) - Sep'26 - QoQstock-summary
Sep'26
Jun'26
Change(%)
Net Sales
545.89
516.63
5.66%
Operating Profit (PBDIT) excl Other Income
142.30
100.97
40.93%
Interest
1.71
1.70
0.59%
Exceptional Items
0.00
0.00
Consolidate Net Profit
122.22
98.19
24.47%
Operating Profit Margin (Excl OI)
26.07%
19.54%
6.53%
Values in Rs Cr.
Direction Arrows
Net Sales

QoQ Growth in quarter ended Sep 2026 is 5.66% vs 12.74% in Jun 2026

Direction Arrows
Consolidated Net Profit

QoQ Growth in quarter ended Sep 2026 is 24.47% vs 8.97% in Jun 2026

Half Yearly Results Snapshot (Standalone) - Sep'25stock-summary
Sep'25
Sep'24
Change(%)
Net Sales
365.12
303.80
20.18%
Operating Profit (PBDIT) excl Other Income
200.05
166.86
19.89%
Interest
0.05
0.04
25.00%
Exceptional Items
0.00
0.00
Standalone Net Profit
203.04
168.38
20.58%
Operating Profit Margin (Excl OI)
54.79%
54.92%
-0.13%
Values in Rs Cr.
Net Sales

Not Applicable: The company has declared_date for only one period

Standalone Net Profit

Not Applicable: The company has declared_date for only one period

Nine Monthly Results Snapshot (Standalone) - Dec'25stock-summary
Dec'25
Dec'24
Change(%)
Net Sales
534.11
452.09
18.14%
Operating Profit (PBDIT) excl Other Income
290.53
247.68
17.30%
Interest
0.09
0.06
50.00%
Exceptional Items
0.00
0.00
Standalone Net Profit
280.92
245.86
14.26%
Operating Profit Margin (Excl OI)
54.40%
54.79%
-0.39%
Values in Rs Cr.
Net Sales

Not Applicable: The company has declared_date for only one period

Standalone Net Profit

Not Applicable: The company has declared_date for only one period

Annual Results Snapshot (Consolidated) - Mar'26stock-summary
Mar'26
Mar'25
Change(%)
Net Sales
1,529.96
1,420.21
7.73%
Operating Profit (PBDIT) excl Other Income
434.40
375.49
15.69%
Interest
6.70
4.02
66.67%
Exceptional Items
0.00
0.00
Consolidate Net Profit
379.74
343.12
10.67%
Operating Profit Margin (Excl OI)
28.39%
26.44%
1.95%
Values in Rs Cr.
Direction Arrows
Net Sales

YoY Growth in year ended Mar 2026 is 7.73% vs 11.98% in Mar 2025

Direction Arrows
Consolidated Net Profit

YoY Growth in year ended Mar 2026 is 10.67% vs 24.57% in Mar 2025

stock-summaryCompany CV
About National Securities Depository Ltd stock-summary
stock-summary
National Securities Depository Ltd
Small Cap
Capital Markets
National Security Depository Limited was incorporated on April 27, 2012, as "NSDL Depository Limited" in Mumbai as a Public Limited Company, pursuant to a Certificate of Incorporation. The Company is a SEBI registered market infrastructure institution (MII) offering a wide range of products and services to the financial and securities markets in India. The Company commenced operations through a Certificate of Commencement of Business dated May 16, 2012, issued by the RoC.
Company Coordinates stock-summary
Icon
No Company Details Available