
 Score
Dashboard
Weak Long Term Fundamental Strength with an average Return on Equity (ROE) of 5.61%
- Poor long term growth as Net Sales has grown by an annual rate of -7.25%
Stock is technically in a Bearish range
With ROE of 0.5, it has a Very Expensive valuation with a 0.5 Price to Book Value
Falling Participation by Institutional Investors
Mojo ParametersStock DNA

Non Banking Financial Company (NBFC)

INR 219 Cr (Micro Cap)

99.00
20

0.00%

0.00

0.52%

0.54
Total ReturnsTotal Returns (Price + Dividend) 
Latest dividend: 1 per share ex-dividend date: Sep-07-2015
Risk Adjusted Returns v/s
Returns Beta
 News & Corporate Actions
News
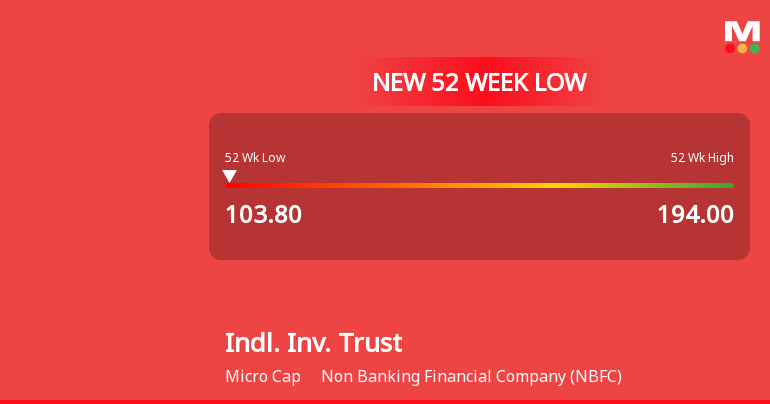
Markets Rally, But Industrial Investment Trust Ltd Sinks to 52-Week Low in Stock-Specific Sell-Off
While the Sensex has gained steadily over the past three weeks, Industrial Investment Trust Ltd has diverged sharply, hitting a fresh 52-week low of Rs 103.8 on 19 Nov 2026. This decline comes despite a recent surge in quarterly profits, underscoring a complex disconnect between the company’s financial performance and its market valuation.
Read More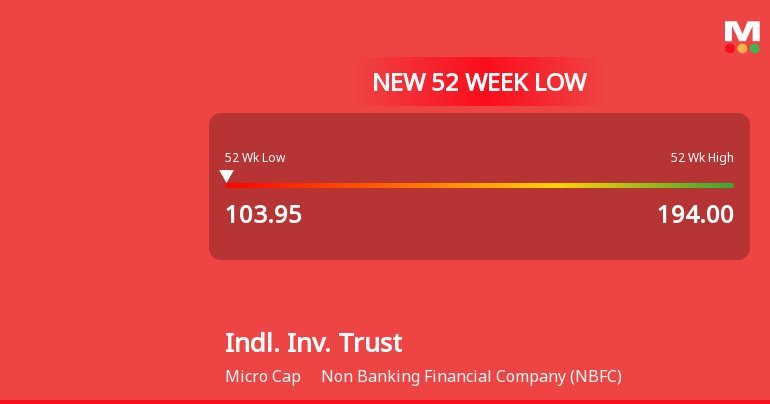
Industrial Investment Trust Ltd Falls to 52-Week Low of Rs 103.95 as Sell-Off Deepens
A sharp decline has pushed Industrial Investment Trust Ltd to a fresh 52-week low of Rs 103.95 on 18 Nov 2026, marking a 41.15% drop over the past year amid persistent selling pressure despite some recent financial improvements.
Read More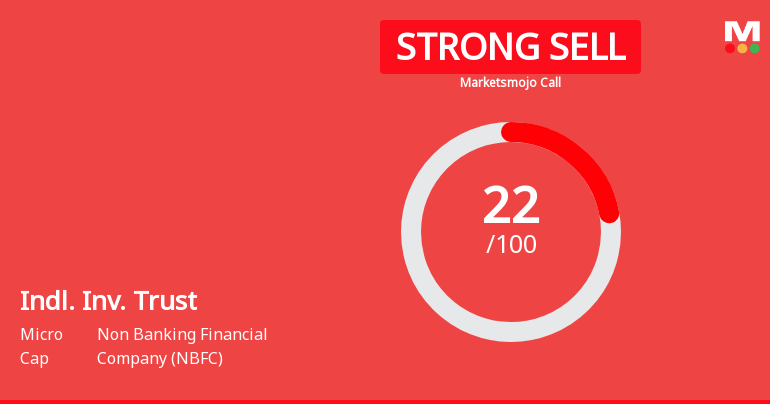
Industrial Investment Trust Ltd is Rated Strong Sell
Industrial Investment Trust Ltd is rated Strong Sell by MarketsMOJO, with this rating last updated on 02 Nov 2026. However, the analysis and financial metrics discussed here reflect the stock’s current position as of 18 November 2026, providing investors with an up-to-date view of the company’s fundamentals, valuation, financial trends, and technical outlook.
Read More Announcements
Announcement under Regulation 30 (LODR)-Newspaper Publication
02-Nov-2026 | Source : BSEPursuant to Regulation 47 (1) (b) of SEBI (LODR) attached please find the scanned copy of the newspaper release of the Unaudited Financial Results (Standalone and Consolidated) for the quarter and half year ended 30.09.2026 published in Free Press Journal (English) and Navshakti (Marathi) of November 01 2026.
Intimation Under Regulation 30 Read With Schedule III Of The SEBI (Listing Obligations And Disclosure Requirements) Regulations 2015
31-Oct-2026 | Source : BSEIntimation under Regulation 30 of SEBI LODR 2015
Unaudited Financial Results (Standalone & Consolidated) For The Quarter And Half Year Ended September 30 2026 - Regulations 30 33 And Other Applicable Provisions Of The
31-Oct-2026 | Source : BSE Corporate Actions

No Upcoming Board Meetings

Industrial Investment Trust Ltd has declared 10% dividend, ex-date: 07 Sep 15

No Splits history available

No Bonus history available

No Rights history available
Key FactorsQuality key factors
Valuation key factors
Technicals key factors
 Technical Indicator Scale: Bearish, Mildly Bearish, Sideways, Mildly Bullish, Bullish Turned Shareholding
Shareholding Snapshot : Sep 2026
Shareholding Compare (%holding)
Promoters
None
Held by 0 Schemes
Held by 2 FIIs (0.19%)
N N Financial Services P Ltd (39.41%)
Hn Safal Infra Developers Private Limited (6.12%)
16.55%
FinancialQuarterly Results Snapshot (Consolidated) - Sep'26 - QoQ
 Compare with Peers

QoQ Growth in quarter ended Sep 2026 is -58.29% vs 165.20% in Jun 2026
QoQ Growth in quarter ended Sep 2026 is -58.79% vs 160.02% in Jun 2026

Half Yearly Results Snapshot (Consolidated) - Sep'25
Growth in half year ended Sep 2025 is -43.70% vs 130.83% in Sep 2024
Growth in half year ended Sep 2025 is -58.20% vs 274.44% in Sep 2024
Nine Monthly Results Snapshot (Consolidated) - Dec'25

YoY Growth in nine months ended Dec 2025 is 17.64% vs 17.08% in Dec 2024
YoY Growth in nine months ended Dec 2025 is 13.34% vs -70.86% in Dec 2024
Annual Results Snapshot (Consolidated) - Mar'26
YoY Growth in year ended Mar 2026 is -192.70% vs -54.54% in Mar 2025
YoY Growth in year ended Mar 2026 is -409.73% vs -93.82% in Mar 2025
 Company CV
About Industrial Investment Trust Ltd

Company Coordinates


