
 Score
Dashboard
With a Operating Losses, the company has a Weak Long Term Fundamental Strength
- Poor long term growth as Net Sales has grown by an annual rate of -25.04% over the last 5 years
- Low ability to service debt as the company has a high Debt to EBITDA ratio of -1.00 times
Flat results in Sep 26
With ROCE of 14.8, it has a Very Expensive valuation with a 8 Enterprise value to Capital Employed
Reducing Promoter Confidence
Mojo ParametersStock DNA

Iron & Steel Products

INR 998 Cr (Micro Cap)

NA (Loss Making)
21

0.00%

2.01

38.44%

22.29
Total ReturnsTotal Returns (Price + Dividend) 
India Homes for the last several years.
Risk Adjusted Returns v/s
Returns Beta
 News & Corporate Actions
News
India Homes Ltd is Rated Sell
India Homes Ltd is rated 'Sell' by MarketsMOJO, with this rating last updated on 13 October 2026. However, the analysis and financial metrics discussed here reflect the stock's current position as of 16 November 2026, providing investors with an up-to-date view of the company’s fundamentals, valuation, financial trend, and technical outlook.
Read More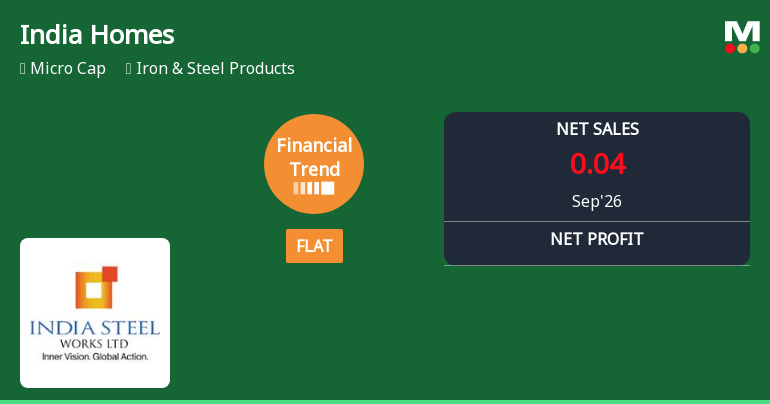
India Homes Ltd Reports Flat Quarterly Performance Amid Strong Long-Term Returns
India Homes Ltd, a micro-cap player in the Iron & Steel Products sector, has reported a flat financial performance for the quarter ended September 2026, signalling a shift from its previously positive growth trajectory. Despite a robust year-to-date return of 121.39%, the company’s recent quarterly metrics reveal a deceleration in revenue growth and margin expansion, prompting a downgrade in its Mojo Grade from Hold to Sell.
Read More
India Homes Ltd is Rated Sell by MarketsMOJO
India Homes Ltd is rated 'Sell' by MarketsMOJO, with this rating last updated on 13 October 2026. However, the analysis and financial metrics presented here reflect the stock's current position as of 05 November 2026, providing investors with the latest insights into the company's fundamentals, valuation, financial trends, and technical outlook.
Read More Announcements
Announcement under Regulation 30 (LODR)-Newspaper Publication
06-Nov-2026 | Source : BSENewpaper advertisement of the Financial results of the Company for the Quarter & half year ended 30 09 2026
Announcement under Regulation 30 (LODR)-Press Release / Media Release
05-Nov-2026 | Source : BSEPress release on financial results for the Quarter & half year ended 30 09 2026
Announcement under Regulation 30 (LODR)-Investor Presentation
05-Nov-2026 | Source : BSEInvestor presentation for the Quarter ended 30 09 2026 FY 2027
Corporate Actions

No Upcoming Board Meetings

No Dividend history available

No Splits history available

No Bonus history available

No Rights history available
Key FactorsQuality key factors
Valuation key factors
Technicals key factors
 Technical Indicator Scale: Bearish, Mildly Bearish, Sideways, Mildly Bullish, Bullish Turned Shareholding
Shareholding Snapshot : Sep 2026
Shareholding Compare (%holding)
Non Institution
10.1213
Held by 3 Schemes (0.0%)
Held by 1 FIIs (0.15%)
Yeotmal Land Development And Trading Company Private Limited (10.97%)
Tb Investments Ltd (6.78%)
24.78%
FinancialQuarterly Results Snapshot (Standalone) - Sep'26 - QoQ
 Compare with Peers

QoQ Growth in quarter ended Sep 2026 is 0.00% vs -100.00% in Jun 2026
QoQ Growth in quarter ended Sep 2026 is 24.13% vs -84.95% in Jun 2026

Half Yearly Results Snapshot (Standalone) - Sep'25
Growth in half year ended Sep 2025 is 0.00% vs -100.00% in Sep 2024

Growth in half year ended Sep 2025 is 30.63% vs 41.99% in Sep 2024
Nine Monthly Results Snapshot (Standalone) - Dec'25
YoY Growth in nine months ended Dec 2025 is 0.00% vs -100.00% in Dec 2024
YoY Growth in nine months ended Dec 2025 is 58.47% vs 43.22% in Dec 2024
Annual Results Snapshot (Standalone) - Mar'26
YoY Growth in year ended Mar 2026 is 2,44,900.00% vs -98.78% in Mar 2025
YoY Growth in year ended Mar 2026 is 239.36% vs -15.23% in Mar 2025
 Company CV
About India Homes Ltd

Company Coordinates


