
 Score
Dashboard
High Debt company with Weak Long Term Fundamental Strength
- Poor long term growth as Net Sales has grown by an annual rate of 14.21% over the last 5 years
- High Debt Company with a Debt to Equity ratio (avg) at 3.94 times
- The company has been able to generate a Return on Capital Employed (avg) of 9.84% signifying low profitability per unit of total capital (equity and debt)
Underperformed the market in the last 1 year
Mojo ParametersStock DNA

Industrial Manufacturing

INR 20 Cr (Micro Cap)

3.00
16

0.00%

1.73

36.29%

1.17
Total ReturnsTotal Returns (Price + Dividend) 
Harish Textile for the last several years.
Risk Adjusted Returns v/s
Returns Beta
 News & Corporate Actions
News
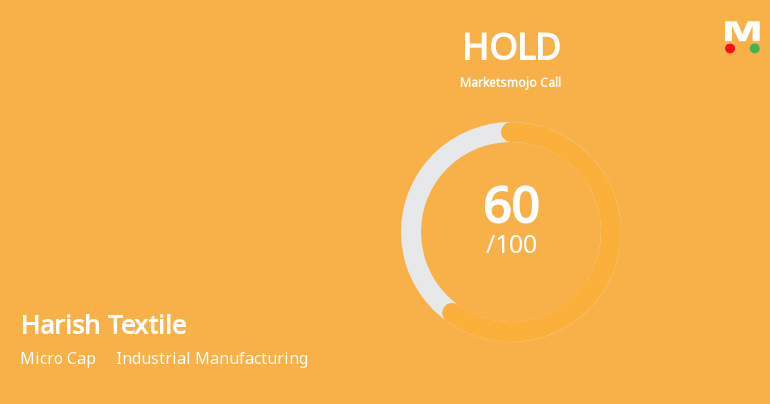
Harish Textile Engineers Ltd Upgraded to Hold on Improved Technicals and Financial Performance
Harish Textile Engineers Ltd has seen its investment rating upgraded from Sell to Hold as of 14 Oct 2026, reflecting a marked improvement in technical indicators and sustained positive financial performance. The company’s Mojo Score has risen to 60.0, signalling a more balanced outlook amid a micro-cap valuation and a recent 6.15% intraday price surge.
Read More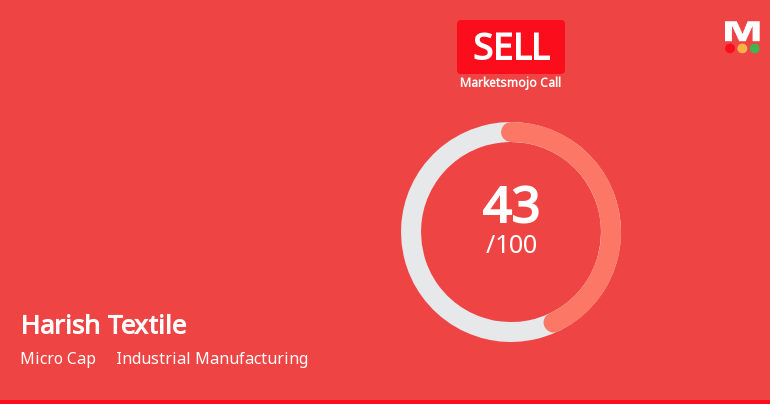
Harish Textile Engineers Ltd Downgraded to Sell Amid Mixed Financial and Technical Signals
Harish Textile Engineers Ltd, a micro-cap player in the industrial manufacturing sector, has seen its investment rating downgraded from Hold to Sell as of 6 October 2026. This shift reflects a complex interplay of deteriorating technical indicators, modest financial trends, valuation considerations, and quality assessments, signalling caution for investors despite some positive operational results.
Read More Announcements
Announcement under Regulation 30 (LODR)-Newspaper Publication
05-Nov-2026 | Source : BSEPlease find attached herewith Newspaper Advertisement for Adoption of Unaudited Financial Results for Quarter and Half Year Ended on 30th September 2026.
Disclosure Under Regulation 30 Of The Securities And Exchange Board Of India (Listing Obligations And Disclosure Requirements) 2015.
05-Nov-2026 | Source : BSEPlease find enclosed herewith Intimation under Regulation 30 of SEBI LODR 2015 for intimation for Notice.
Board Meeting Outcome for Outcome Of Board Meeting Held On 03Rd November 2026 Pursuant To Regulation 30 Of The SEBI (Listing Obligations And Disclosure Requirements) Regulations 2015.
03-Nov-2026 | Source : BSEWe hereby inform you that at the meeting of the Board of Directors of the Company held today i.e. on Tuesday 03rd November 2026 at the registered office the Board inter alia considered and approved the Standalone Unaudited Financial Results of the Company for the second quarter and half year ended 30th September 2026 together with the Limited Review Report of the Statutory Auditors pursuant to Regulation 33 of the SEBI (Listing Obligations and Disclosure Requirements) Regulations 2015. PFA herewith 1. Unaudited Financial Results (Standalone) of the Company for the second quarter and half year ended 30th September 2026 and 2. Copy of the Limited Review Report.
Corporate Actions

No Upcoming Board Meetings

No Dividend history available

No Splits history available

No Bonus history available

No Rights history available
Key FactorsQuality key factors
Valuation key factors
Technicals key factors
 Technical Indicator Scale: Bearish, Mildly Bearish, Sideways, Mildly Bullish, Bullish Turned Shareholding
Shareholding Snapshot : Sep 2026
Shareholding Compare (%holding)
Non Institution
None
Held by 2 Schemes (0.05%)
Held by 0 FIIs
Sandeep Kirtikumar Gandhi (48.1%)
Ram Pal Naraniwal (3.24%)
44.74%
FinancialQuarterly Results Snapshot (Standalone) - Sep'26 - QoQ
 Compare with Peers

QoQ Growth in quarter ended Sep 2026 is 14.88% vs 8.47% in Jun 2026
QoQ Growth in quarter ended Sep 2026 is 126.67% vs -51.35% in Jun 2026

Half Yearly Results Snapshot (Standalone) - Sep'25

Growth in half year ended Sep 2025 is 1.11% vs 8.49% in Sep 2024
Growth in half year ended Sep 2025 is 344.94% vs -271.15% in Sep 2024
Nine Monthly Results Snapshot (Standalone) - Dec'25
YoY Growth in nine months ended Dec 2025 is 2.84% vs 4.31% in Dec 2024
YoY Growth in nine months ended Dec 2025 is 388.28% vs -337.04% in Dec 2024
Annual Results Snapshot (Standalone) - Mar'26
YoY Growth in year ended Mar 2026 is 4.89% vs 0.76% in Mar 2025
YoY Growth in year ended Mar 2026 is 2,208.33% vs 164.86% in Mar 2025
 Company CV
About Harish Textile Engineers Ltd

Company Coordinates
