
 Score
Dashboard
With a Negative Book Value, the company has a Weak Long Term Fundamental Strength
- Poor long term growth as Net Sales has grown by an annual rate of 8.90% and Operating profit at 0% over the last 5 years
- High Debt Company with a Debt to Equity ratio (avg) at 0 times
Flat results in Sep 26
Risky - Negative Book Value
Mojo ParametersStock DNA

Trading & Distributors

INR 7 Cr (Micro Cap)

231.00
19

0.00%

-0.13

-3.00%

-7.05
Total ReturnsTotal Returns (Price + Dividend) 
Grandma Trading for the last several years.
Risk Adjusted Returns v/s
Returns Beta
 News & Corporate Actions
News

Grandma Trading & Agencies Ltd Upgraded to Sell on Technical Improvements
Grandma Trading & Agencies Ltd has seen its investment rating upgraded from Strong Sell to Sell, driven primarily by a shift in technical indicators despite ongoing concerns over its financial performance and valuation metrics. The micro-cap stock’s recent technical trend improvements contrast with its flat quarterly results and high-risk fundamentals, presenting a nuanced outlook for investors.
Read More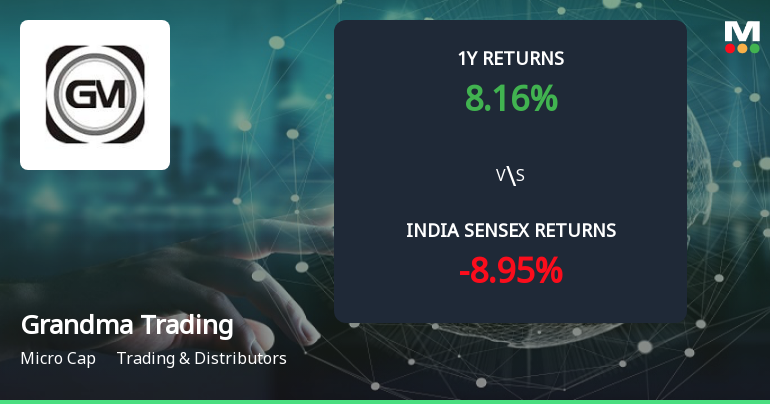
Golden Cross Forms in Grandma Trading & Agencies Ltd — On a Day the Stock Fell 1.85%. What the Mixed Signals Mean
The 50-day moving average has crossed above the 200-day moving average for Grandma Trading & Agencies Ltd, signalling a golden cross on 25 Sep 2026. Yet, the stock declined 1.85% on the same day, while monthly momentum indicators remain bearish. This juxtaposition of signals calls for a detailed examination of whether the golden cross stands on firm ground or is contradicted by broader data.
Read More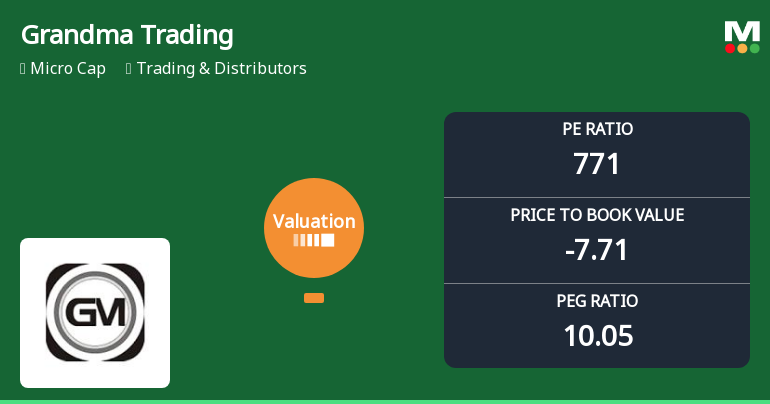
Grandma Trading & Agencies Ltd Faces Sharp Valuation Reassessment Amid Elevated Risk
Grandma Trading & Agencies Ltd has witnessed a marked deterioration in its valuation parameters, shifting from a previously expensive profile to one categorised as risky. This transition, underscored by an extraordinary price-to-earnings (P/E) ratio and a deeply negative price-to-book value (P/BV), raises significant concerns for investors amid the company’s ongoing financial struggles and micro-cap status.
Read More Announcements
Announcement under Regulation 30 (LODR)-Newspaper Publication
16-Nov-2026 | Source : BSENewspaper Publication of Un-audited Financial Result for the Quarter and Six Months Ended September 30 2026.
Board Meeting Outcome for Un-Audited Financial Results And Limited Review Report For The Quarter And Six Months Ended On 30Th September 2026 As Per Regulation 33 Of The SEBI (Listing Obligations And Disclosure Requirements) Regulations 2015.
14-Nov-2026 | Source : BSEUn-Audited Financial Results and Limited Review Report for the Quarter and Six months ended on 30th September 2026 as Per Regulation 33 of the SEBI (Listing Obligations And Disclosure Requirements) Regulations 2015.
Un-Audited Financial Results For The Quarter And Six Months Ended 30Th September 2026
14-Nov-2026 | Source : BSEUn-audited Financial Result for the quarter and six months ended 30th September2026
Corporate Actions

No Upcoming Board Meetings

No Dividend history available

Grandma Trading & Agencies Ltd has announced 1:10 stock split, ex-date: 26 Feb 15

No Bonus history available

No Rights history available
Key FactorsQuality key factors
Valuation key factors
Technicals key factors
 Technical Indicator Scale: Bearish, Mildly Bearish, Sideways, Mildly Bullish, Bullish Turned Shareholding
Shareholding Snapshot : Sep 2026
Shareholding Compare (%holding)
Non Institution
None
Held by 0 Schemes
Held by 0 FIIs
Bharat Bansilal Jain (6.01%)
Segment Agencies Pvt. Ltd. (4.96%)
43.07%
FinancialQuarterly Results Snapshot (Standalone) - Sep'26 - QoQ
 Compare with Peers

QoQ Growth in quarter ended Sep 2026 is -30.77% vs -65.79% in Jun 2026

QoQ Growth in quarter ended Sep 2026 is -250.00% vs -71.43% in Jun 2026

Half Yearly Results Snapshot (Standalone) - Sep'25
Growth in half year ended Sep 2025 is -75.00% vs 0.00% in Sep 2024
Growth in half year ended Sep 2025 is 91.85% vs -938.46% in Sep 2024
Nine Monthly Results Snapshot (Standalone) - Dec'25
YoY Growth in nine months ended Dec 2025 is -16.67% vs 0.00% in Dec 2024
YoY Growth in nine months ended Dec 2025 is 89.78% vs -1,270.00% in Dec 2024
Annual Results Snapshot (Standalone) - Mar'26
YoY Growth in year ended Mar 2026 is 140.91% vs 69.23% in Mar 2025
YoY Growth in year ended Mar 2026 is 95.17% vs -7,150.00% in Mar 2025
 Company CV
About Grandma Trading & Agencies Ltd

Company Coordinates


