
 Score
Dashboard
Weak Long Term Fundamental Strength with a -10.47% CAGR growth in Operating Profits over the last 5 years
- Company's ability to service its debt is weak with a poor EBIT to Interest (avg) ratio of 0.73
- The company has been able to generate a Return on Equity (avg) of 1.87% signifying low profitability per unit of shareholders funds
Stock is technically in a Mildly Bearish range
57.93% of Promoter Shares are Pledged
Consistent Underperformance against the benchmark over the last 3 years
Mojo ParametersStock DNA

Gems, Jewellery And Watches

INR 12 Cr (Micro Cap)

13.00
41

0.00%

0.10

1.73%

0.24
Total ReturnsTotal Returns (Price + Dividend) 
Gautam Gems for the last several years.
Risk Adjusted Returns v/s
Returns Beta
 News & Corporate Actions
News
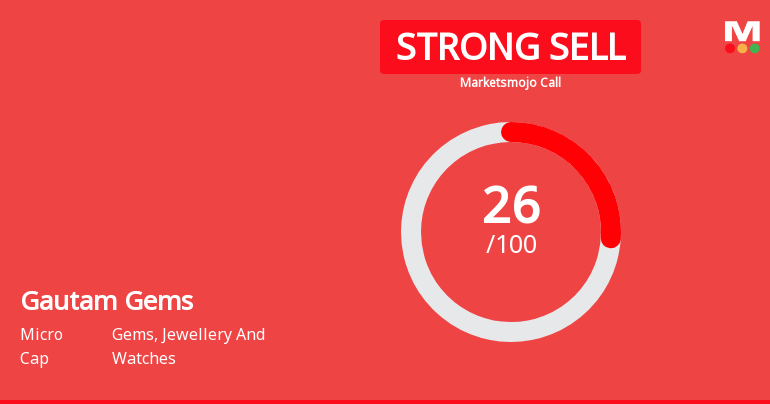
Gautam Gems Ltd Downgraded to Strong Sell Amid Weak Fundamentals and Bearish Technicals
Gautam Gems Ltd, a micro-cap player in the Gems, Jewellery and Watches sector, has been downgraded from a Sell to a Strong Sell rating as of 13 Oct 2026. This revision reflects deteriorating technical indicators, stagnant financial performance, and persistent valuation concerns, signalling heightened risks for investors amid ongoing market underperformance.
Read More Announcements
Disclosure Under Regulation 30 Of The SEBI (LODR) Regulations 2015 - Change Of Corporate Office Of Kfin Technologies Limited Our RTA
04-Nov-2026 | Source : BSEIntimation regarding Relocation of Corporate Office of the RTA
Board Meeting Outcome for Outcome Of The Meeting Of Board Of Directors Of The Company Held On November 03
03-Nov-2026 | Source : BSEResults Financial Results For Sep 30 2026
03-Nov-2026 | Source : BSEThe Board of Directors of the company has considered and approved unaudited financial statement of the company for quarter and Half Year ended 30th September 2026 as attached
Corporate Actions

No Upcoming Board Meetings

No Dividend history available

No Splits history available

No Bonus history available

Gautam Gems Ltd has announced 4:1 rights issue, ex-date: 01 Sep 22
Key FactorsQuality key factors
Valuation key factors
Technicals key factors
 Technical Indicator Scale: Bearish, Mildly Bearish, Sideways, Mildly Bullish, Bullish Turned Shareholding
Shareholding Snapshot : Sep 2026
Shareholding Compare (%holding)
Non Institution
57.9309
Held by 0 Schemes
Held by 0 FIIs
Gautam Pravinchandra Sheth (21.8%)
Veeram Barter Private Limited (10.87%)
57.67%
FinancialQuarterly Results Snapshot (Standalone) - Sep'26 - YoY
 Compare with Peers

YoY Growth in quarter ended Sep 2026 is 159.80% vs 39.34% in Sep 2025
YoY Growth in quarter ended Sep 2026 is 100.00% vs 40.00% in Sep 2025

Half Yearly Results Snapshot (Standalone) - Sep'25
Growth in half year ended Sep 2025 is 9.61% vs -16.61% in Sep 2024
Growth in half year ended Sep 2025 is 23.53% vs -58.54% in Sep 2024
Nine Monthly Results Snapshot (Standalone) - Dec'25
YoY Growth in nine months ended Dec 2025 is 7.05% vs -55.24% in Dec 2024
YoY Growth in nine months ended Dec 2025 is 0.00% vs -70.87% in Dec 2024
Annual Results Snapshot (Standalone) - Mar'26
YoY Growth in year ended Mar 2026 is 1.75% vs -22.70% in Mar 2025
YoY Growth in year ended Mar 2026 is 150.00% vs -26.32% in Mar 2025
 Company CV
About Gautam Gems Ltd

Company Coordinates


