Excel Industries

  • Market Cap: Micro Cap
  • Industry: Specialty Chemicals
  • ISIN: INE369A01029
  • NSEID: EXCELINDUS
  • BSEID: 500650
INR
986.70
-22.35 (-2.21%)
BSENSE

Nov 20

BSE+NSE Vol: 3.92 k

  • Price Points
  • Score
  • Mojo Parameters
  • Total Return
  • News and Corporate Actions
  • Key factors
  • Shareholding
  • Financials
  • CompanyCV
stock-summaryPrice Point
High/Low

1Day

52 Week

Valuation
Technical
Day's Volume

CASH

3.92 k (-33.07%) Volume

Shareholding (Sep 2026)

FII

1.67%

Held by 34 FIIs

DII

7.01%

Held by 1 DIIs

Promoter

51.86%

Who are in the management team of Excel Industries?

06-Jun-2025

As of March 2023, the management team of Excel Industries includes A C Shroff (Executive Chairman), Ravi A Shroff (Managing Director), and several other directors, both executive and independent, totaling 14 members who guide the company's governance and strategy.

As of March 2023, the management team of Excel Industries includes the following individuals:<BR><BR>1. A C Shroff - Executive Chairman<BR>2. Ravi A Shroff - Executive Director / Managing Director / Promoter<BR>3. Hrishit Ashwin Shroff - Executive Director<BR>4. A G Shroff - Non-Executive Director<BR>5. D K Shroff - Non-Executive Director<BR>6. Ramchandra N Bhogale - Independent Non-Executive Director<BR>7. Harish N Motiwalla - Independent Non-Executive Director<BR>8. P S Jhaveri - Independent Non-Executive Director<BR>9. M B Parekh - Independent Non-Executive Director<BR>10. Shailesh S Vaidya - Independent Non-Executive Director<BR>11. Rajeev M Pandia - Independent Non-Executive Director<BR>12. Meena Galliara - Independent Non-Executive Director<BR>13. C Vikas Rao - Non-Executive Director / Nominated<BR>14. Dinesh Kumar Bhagat - Non-Executive Director / Nominated<BR><BR>This diverse team encompasses various roles, including executive, non-executive, and independent directors, contributing to the governance and strategic direction of the company.

Read More

What does Excel Industries do?

06-Jun-2025

Excel Industries Ltd is a manufacturer of industrial and specialty chemicals, bio-fertilizers, and bio-remediation technologies, with a market cap of Rs 1,518 Cr. As of March 2025, it reported net sales of 248 Cr and a net profit of 12 Cr.

Overview:<BR>Excel Industries Ltd is a manufacturer of industrial chemicals, specialty chemicals, bio-fertilizers, and bio-remediation technologies, operating in the Specialty Chemicals industry within the Small Cap market-cap bracket.<BR><BR>History:<BR>Incorporated in 1960, Excel Industries has undergone restructuring, notably divesting its Agri business (Pesticides) to Excel Crop Care Ltd effective April 1, 2002. The latest quarterly results reported net sales and net profit for the period ending March 2025.<BR><BR>Financial Snapshot:<BR>- Net Sales: 248 Cr (Quarterly Results - Mar 2025)<BR>- Net Profit: 12 Cr (Quarterly Results - Mar 2025)<BR>- Market Cap: Rs 1,518 Cr (Small Cap)<BR><BR>Key Metrics:<BR>- P/E: 18.00<BR>- Industry P/E: 38<BR>- Dividend Yield: 0.46%<BR>- Debt-Equity: -0.13<BR>- Return on Equity: 5.37%<BR>- Price to Book: 0.94<BR><BR>Contact Details:<BR>Address: 184-87 Swami Vivekanand Road, Jogeshwari (West) Mumbai Maharashtra : 400102 <BR>Tel: 91-22-66464200 <BR>Email: excel.mumbai@excelind.com <BR>Website: http://www.excelind.co.in

Read More

When is the next results date for Excel Industries?

06-Jun-2025

No Upcoming Board Meetings

Has Excel Industries declared dividend?

06-Jun-2025

Yes, Excel Industries Ltd has declared a dividend of 110% (₹5.5 per share) with an ex-date of September 12, 2024. The company has shown positive total returns over longer periods, despite some price fluctuations.

Excel Industries Ltd has declared a dividend.<BR><BR>Dividend Details:<BR>- Percentage announced: 110%<BR>- Amount per share: 5.5<BR>- Ex-date: 12 Sep 24<BR><BR>Dividend Yield: 0.46%.<BR><BR>Total Returns by Period:<BR>In the last 6 months, the price return was -17.82%, with a dividend return of 0%, resulting in a total return of -17.82%.<BR><BR>Over the past year, there was a price return of 15.78% and a dividend return of 0.51%, leading to a total return of 16.29%.<BR><BR>In the 2-year period, the price return was 40.39%, with a dividend return of 1.71%, giving a total return of 42.1%.<BR><BR>For the 3-year period, the price return was -8.41%, and the dividend return was 3.47%, resulting in a total return of -4.94%.<BR><BR>In the last 4 years, the price return was 9.32%, with a dividend return of 4.77%, culminating in a total return of 14.09%.<BR><BR>Over the 5-year period, the price return was 88.43%, and the dividend return was 6.86%, resulting in a total return of 95.29%.<BR><BR>Overall, Excel Industries has declared a significant dividend, which contributes positively to the total returns, particularly over longer periods, despite some fluctuations in price returns. The company shows a promising total return trend over five years, indicating potential for investors.

Read More

Who are the peers of the Excel Industries?

03-Jun-2025

Excel Industries' peers include Pidilite Industries, SRF, Gujarat Fluoroch, Deepak Nitrite, Himadri Special, Platinum Industries, Paushak, Valiant Organics, and Oriental Aromat. Key metrics show varying management risks, growth rates, and capital structures among these companies, with Himadri Special leading in 1-year returns at 41.42% and Deepak Nitrite having the lowest at -9.57%.

Peers: The peers of Excel Industries are Pidilite Inds., SRF, Gujarat Fluoroch, Deepak Nitrite, Himadri Special, Platinum Industr, Paushak, Valiant Organics, and Oriental Aromat.<BR><BR>Quality Snapshot: Excellent management risk is observed at Deepak Nitrite, Pidilite Inds., and SRF, while Average management risk is found at Gujarat Fluoroch, Himadri Special, Excel Industries, Platinum Industr, Paushak, Valiant Organics, and Oriental Aromat. Growth is Average for Pidilite Inds., SRF, and Platinum Industr, while Below Average growth is noted for Gujarat Fluoroch, Deepak Nitrite, Excel Industries, Paushak, Valiant Organics, and Oriental Aromat. Good growth is seen at Himadri Special, and the rest have Below Average growth. Capital Structure is Excellent for Pidilite Inds., SRF, Deepak Nitrite, Excel Industries, Platinum Industr, and Paushak, while Good capital structure is noted for Gujarat Fluoroch and Valiant Organics, and Average for Himadri Special and Oriental Aromat.<BR><BR>Return Snapshot: The peer with the highest 1-year return is Himadri Special at 41.42%, while the lowest is Deepak Nitrite at -9.57%. Excel Industries has a 1-year return of 11.84%, which is higher than Deepak Nitrite but lower than Himadri Special. Additionally, the peers with negative six-month returns are Deepak Nitrite, Platinum Industr, Paushak, and Oriental Aromat.

Read More

Who are the top shareholders of the Excel Industries?

17-Jul-2025

The top shareholders of Excel Industries include Anshul Specialty Molecules Private Limited with 42.92%, Life Insurance Corporation of India with 6.69%, and individual investors holding 31.03%. Additionally, 40 foreign institutional investors hold a combined 2.05%, while mutual funds account for 0.01%.

The top shareholders of Excel Industries include several key players. The majority of the shares are held by promoters, with Anshul Specialty Molecules Private Limited being the largest promoter, holding 42.92%. Additionally, Life Insurance Corporation of India is the highest public shareholder with a 6.69% stake. The company also has 40 foreign institutional investors (FIIs) holding a combined 2.05%, and mutual funds are represented by four schemes with a minimal holding of 0.01%. Individual investors collectively hold 31.03% of the shares.

Read More

How big is Excel Industries?

24-Jul-2025

As of 24th July, Excel Industries Ltd has a market capitalization of 1,740.00 Cr, with recent Net Sales of 978.07 Cr and a Net Profit of 85.31 Cr. Shareholder's Funds are 1,427.06 Cr and Total Assets are 1,795.47 Cr as of March 2024.

As of 24th July, Excel Industries Ltd has a market capitalization of 1,740.00 Cr, categorizing it as a Small Cap company.<BR><BR>For the latest four quarters, the company reported Net Sales of 978.07 Cr and a Net Profit of 85.31 Cr.<BR><BR>The latest annual period for the balance sheet is March 2024, with Shareholder's Funds amounting to 1,427.06 Cr and Total Assets valued at 1,795.47 Cr.

Read More

Are Excel Industries latest results good or bad?

09-Aug-2025

Excel Industries reported strong financial results for June 2025, with a 55.9% increase in Profit Before Tax and a 26.6% rise in net sales, indicating positive performance. However, concerns arise from declining operating cash flow and increased reliance on non-operating income, suggesting challenges ahead.

Excel Industries has reported strong financial results for the quarter ending June 2025, indicating a positive trend in its performance. The company achieved a Profit Before Tax (PBT) of Rs 32.25 crore, which is a substantial increase of 55.9% compared to the average PBT from the previous four quarters. Similarly, the Profit After Tax (PAT) rose to Rs 33.76 crore, marking a 58.3% increase over the prior average.<BR><BR>Net sales also reached Rs 309.52 crore, the highest in the last five quarters, reflecting a growth of 26.6% compared to the previous four-quarter average. Additionally, the consolidated net profit showed remarkable growth, increasing by 172.04% quarter-over-quarter.<BR><BR>However, there are some challenges to consider. The operating cash flow has declined to Rs 61.82 crore, the lowest in three years, which raises some concerns about the company's cash management. Furthermore, an increase in non-operating income to Rs 12.21 crore may indicate reliance on non-core activities, which could affect sustainability in the long term.<BR><BR>Overall, while the latest results show significant improvements in profitability and sales, the decline in operating cash flow and reliance on non-operating income suggest that Excel Industries faces some challenges that need to be addressed.

Read More

Is Excel Industries technically bullish or bearish?

10-Nov-2025

As of November 7, 2025, the technical trend is bearish with moderate strength, driven by negative signals from the MACD, Bollinger Bands, and moving averages, despite a bullish OBV on the monthly timeframe.

As of 7 November 2025, the technical trend has changed from mildly bearish to bearish. The current technical stance is bearish with a moderate strength. Key indicators driving this stance include the weekly MACD and Bollinger Bands both showing bearish signals, along with daily moving averages confirming a bearish trend. The KST is also bearish on the weekly timeframe, while the Dow Theory indicates a mildly bearish outlook on both weekly and monthly scales. Despite the OBV showing a bullish signal on the monthly, the overall sentiment remains bearish due to the predominance of negative indicators across multiple timeframes.

Read More

How has been the historical performance of Excel Industries?

12-Nov-2025

Excel Industries' historical performance shows a decline in net sales from 1,178.02 Cr in March 2022 to 978.07 Cr in March 2025, alongside a significant drop in operating profit. However, profit before tax and profit after tax increased in the same period, indicating mixed financial outcomes.

Answer:<BR>The historical performance of Excel Industries shows fluctuations in key financial metrics over the years.<BR><BR>Breakdown:<BR>Excel Industries' net sales peaked at 1,178.02 Cr in March 2022 but have since declined to 978.07 Cr in March 2025, reflecting a downward trend from the previous year’s sales of 1,089.82 Cr. Total operating income followed a similar pattern, decreasing from 1,178.02 Cr in March 2022 to 978.07 Cr in March 2025. The total expenditure, excluding depreciation, was 858.50 Cr in March 2025, up from 802.48 Cr in March 2024, indicating rising costs. Operating profit (PBDIT) saw a significant drop to 149.79 Cr in March 2025 from 246.06 Cr in March 2022, with the operating profit margin also declining to 12.23%. Profit before tax increased to 113.35 Cr in March 2025, up from 23.35 Cr in March 2024, while profit after tax rose to 85.72 Cr from 17.71 Cr in the same period. The company's total assets grew to 1,920.18 Cr in March 2025 from 1,795.47 Cr in March 2024, with total liabilities also increasing to 1,920.18 Cr. Cash flow from operating activities decreased to 61.00 Cr in March 2025 from 72.00 Cr in March 2024, while net cash inflow was 4.00 Cr, consistent with the previous year. Overall, Excel Industries has experienced a mix of growth in certain areas while facing challenges in profitability and sales.

Read More

How has been the historical performance of Excel Industries?

13-Nov-2025

Excel Industries experienced fluctuating financial performance, with net sales increasing to 978.07 Cr in March 2025 from 826.14 Cr in March 2024, and a significant rise in profit after tax to 85.72 Cr from 17.71 Cr. Despite some previous declines, the latest fiscal year shows recovery in profitability and sales growth.

Answer:<BR>The historical performance of Excel Industries shows fluctuations in key financial metrics over the years, with notable changes in revenue and profitability.<BR><BR>Breakdown:<BR>Excel Industries reported net sales of 978.07 Cr in March 2025, an increase from 826.14 Cr in March 2024, but a decline from 1,089.82 Cr in March 2023. The total operating income followed a similar trend, reaching 978.07 Cr in March 2025 compared to 826.14 Cr in the previous year. The company's total expenditure, excluding depreciation, was 858.50 Cr in March 2025, up from 802.48 Cr in March 2024, while operating profit (PBDIT) increased to 149.79 Cr from 56.66 Cr. Profit before tax also rose to 113.35 Cr in March 2025 from 23.35 Cr in March 2024, leading to a profit after tax of 85.72 Cr, significantly higher than 17.71 Cr in the previous year. The earnings per share (EPS) surged to 67.81 in March 2025 from 13.52 in March 2024. On the balance sheet, total assets increased to 1,920.18 Cr in March 2025 from 1,795.47 Cr in March 2024, while total liabilities rose to 1,920.18 Cr from 1,795.47 Cr. The cash flow from operating activities was 61.00 Cr in March 2025, down from 72.00 Cr in March 2024, but the net cash inflow remained positive at 4.00 Cr for both years. Overall, Excel Industries has shown a recovery in profitability and sales growth in the latest fiscal year, despite some fluctuations in previous years.

Read More

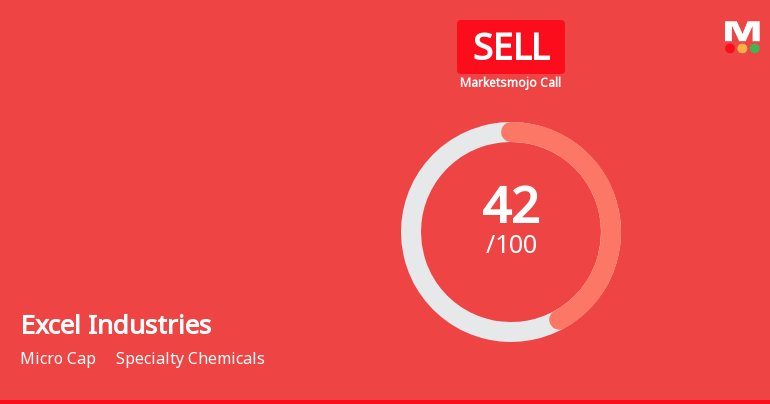
Should I buy, sell or hold Excel Industries?

14-Nov-2025

Is Excel Industries overvalued or undervalued?

24-Nov-2025

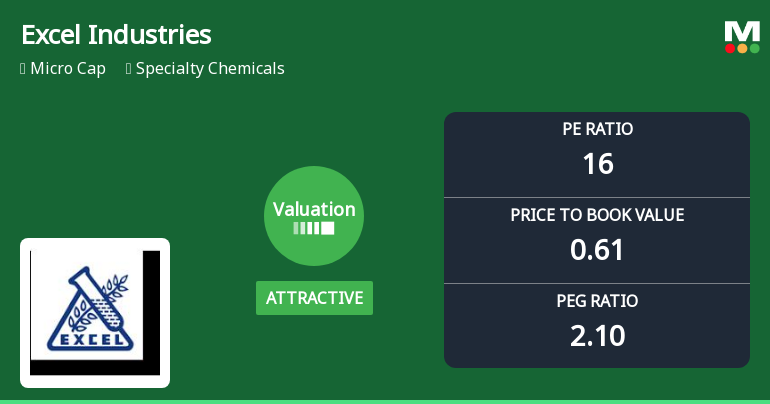
As of November 21, 2025, Excel Industries is considered undervalued with a PE ratio of 16.23 and a PEG ratio of 0.00, making it an attractive investment opportunity despite a year-to-date return of -25.87%.

As of 21 November 2025, the valuation grade for Excel Industries has moved from very attractive to attractive, indicating a shift in perception regarding its investment appeal. The company is currently considered undervalued, with a PE ratio of 16.23, a Price to Book Value of 0.66, and an EV to EBITDA of 9.66. These ratios suggest that Excel Industries is trading at a lower valuation compared to its peers.<BR><BR>In comparison to its industry peers, UPL has a significantly higher PE ratio of 26.53, while BASF India stands at 49.76, both indicating a premium valuation. Additionally, the PEG ratio for Excel Industries is notably low at 0.00, which further supports the argument for undervaluation. Despite recent underperformance, with a year-to-date return of -25.87% compared to the Sensex's 9.08%, the fundamentals suggest that Excel Industries may present a buying opportunity for investors looking for value in the specialty chemicals sector.

Read More

Why is Excel Industries falling/rising?

03-Dec-2025

As of 03-Dec, Excel Industries Ltd's stock price is declining, currently at 936.00, reflecting a total year-to-date drop of -26.93% and a -38.15% decline over the past year, compounded by poor financial performance and low investor confidence. The stock has underperformed against the benchmark Sensex and is trading below its moving averages, indicating a bearish trend.

As of 03-Dec, Excel Industries Ltd's stock price is falling, currently at 936.00, which reflects a decrease of 8.15 (-0.86%). The stock has been on a downward trend, having lost value for the last three consecutive days, resulting in a total decline of -1.62% during this period. Additionally, the stock has significantly underperformed compared to the benchmark Sensex, which has shown a slight decline of only -0.59% over the past week.<BR><BR>Over the longer term, the stock has experienced substantial losses, with a year-to-date decline of -26.93% and a staggering -38.15% drop over the past year. This poor performance is compounded by the fact that the company's profits have decreased by -3.3% during the same timeframe. Furthermore, the stock is trading below its moving averages across various timeframes, indicating a bearish trend.<BR><BR>The company's financial health also raises concerns, as it has shown poor long-term growth with net sales growing at an annual rate of only 9.54% and operating profit at a mere 1.26% over the last five years. The recent operating cash flow results were the lowest recorded, and the profit before tax has fallen by -5.9% compared to the previous four-quarter average. <BR><BR>Investor sentiment appears to be cautious, as evidenced by the low participation from domestic mutual funds, which hold only 0.01% of the company, suggesting a lack of confidence in the stock's future performance. Overall, the combination of declining stock price, poor financial results, and negative investor sentiment contributes to the ongoing fall in Excel Industries' stock price.

Read More
iScoreScore
Click here to find our call on this stock
Strong Sell
Sell
Hold
Buy
Strong Buy
Dashboard
1

Poor long term growth as Net Sales has grown by an annual rate of 3.89% and Operating profit at -6.80% over the last 5 years

 
2

Flat results in Sep 26

3

Stock is technically in a Mildly Bearish range

4

Despite the size of the company, domestic mutual funds hold only 0.01% of the company

stock-summaryMojo Parameters
Mojo Parameters
Loading Valuation Snapshot...
Stock DNA
stock-summary
Industry

Specialty Chemicals

stock-summary
Market cap

INR 1,256 Cr (Micro Cap)

stock-summary
P/E

16.00

stock-summary
Industry P/E

23

stock-summary
Dividend Yield

1.35%

stock-summary
Debt Equity

-0.03

stock-summary
Return on Equity

3.83%

stock-summary
Price to Book

0.62

Revenue and Profits:
Net Sales:
275 Cr
(Quarterly Results - Sep 2026)
Net Profit:
29 Cr
stock-summaryTotal Returns
Total Returns (Price + Dividend) stock-summary
Dividend Yield (1.35%)
TimePeriod
Price Return
Dividend Return
Total Return
3 Months
-11.12%
1.28%
-9.84%
6 Months
2.38%
1.39%
3.77%
1 Year
3.68%
1.45%
5.13%
2 Years
-36.3%
1.84%
-34.46%
3 Years
18.44%
3.77%
22.21%
4 Years
-17.45%
3.69%
-13.76%
5 Years
9.69%
7.63%
17.32%

Latest dividend: 13.721537983854274 per share ex-dividend date: Sep-17-2026

Risk Adjusted Returns v/s stock-summary
Returns Beta
Icon
Beta has not been calculated since enough price history is not available
stock-summaryNews & Corporate Actions
News

Excel Industries Surges 16.83% Amid Bearish Technical Signals: What Drove the Rally?

Announcements stock-summary

Announcement under Regulation 30 (LODR)-Earnings Call Transcript

12-Nov-2026 | Source : BSE

Earning Call Transcript for the Quarter and Half Year Ended 30th September 2026.

Announcement under Regulation 30 (LODR)-Newspaper Publication

06-Nov-2026 | Source : BSE

We refer to our letter dated 4th November 2026 informing about the Companys Unaudited Financial Results for the quarter ended 30th September 2026. In this connection and pursuant to Regulation 47 of the SEBI (Listing Obligations and Disclosure Requirements) Regulations 2015 Please find enclosed the newspaper advertisements published in Business Standard Free Press Journal & Navshakti newspapers.

Announcement under Regulation 30 (LODR)-Analyst / Investor Meet - Outcome

06-Nov-2026 | Source : BSE

Pursuant to Regulation 30 and 46 read with clause 15 of Para A of Part A of Schedule III of the SEBI (Listing Obligations and Disclosure Requirements) Regulations 2015 we hereby confirm that we have uploaded the audio recording of the earnings call for the Quarter and Half year ended September 30 2026 held on Friday 6th November 2026 on our Companys website.

Corporate Actions stock-summary
stock-summary
BOARD MEETING

No Upcoming Board Meetings

stock-summary
DIVIDEND

Excel Industries Ltd has declared 275% dividend, ex-date: 17 Sep 26

stock-summary
SPLITS

No Splits history available

stock-summary
BONUS

No Bonus history available

stock-summary
RIGHTS

No Rights history available

stock-summaryKey Factors
Quality key factors stock-summary
Factor
Value
Sales Growth (5y)
3.89%
EBIT Growth (5y)
-6.80%
EBIT to Interest (avg)
40.00
Debt to EBITDA (avg)
Net Debt is too low
Net Debt to Equity (avg)
-0.03
Sales to Capital Employed (avg)
0.71
Tax Ratio
22.90%
Dividend Payout Ratio
20.26%
Pledged Shares
0
Institutional Holding
8.67%
ROCE (avg)
7.39%
ROE (avg)
5.95%
Valuation key factors
Factor
Value
P/E Ratio
16
Industry P/E
23
Price to Book Value
0.60
EV to EBIT
15.00
EV to EBITDA
10.01
EV to Capital Employed
0.59
EV to Sales
1.08
PEG Ratio
2.08
Dividend Yield
1.40%
ROCE (Latest)
3.91%
ROE (Latest)
3.83%
Technicals key factors
Indicator
Weekly
Monthly
MACD
Mildly Bullish
Mildly Bullish
RSI
No Signal
No Signal
Bollinger Bands
Mildly Bullish
Mildly Bearish
Moving Averages
Mildly Bearish (Daily)
KST
Bearish
Bearish
Dow Theory
Mildly Bullish
Mildly Bearish
OBV
No Trend
Mildly Bearish
stock-summary Technical Indicator Scale: Bearish, Mildly Bearish, Sideways, Mildly Bullish, Bullish  Turned 
stock-summaryShareholding
Shareholding Snapshot : Sep 2026stock-summary
Shareholding Compare (%holding) stock-summary
Majority shareholders

Promoters

Pledged Promoter Holdings

None

Mutual Funds

Held by 4 Schemes (0.01%)

FIIs

Held by 34 FIIs (1.67%)

Promoter with highest holding

Anshul Specialty Molecules Private Limited (42.92%)

Highest Public shareholder

Life Insurance Corporation Of India (6.69%)

Individual Investors Holdings

31.85%

stock-summaryFinancial
[
  {
    "link": "quarterly",
    "btn_text": "All Quarterly Results",
    "header": "Quarterly Results Snapshot (Consolidated) - Sep'26 - QoQ",
    "rhs": [
      {
        "prefix": "Net Sales ",
        "suffix": "QoQ Growth in quarter ended Sep 2026 is -6.52% vs 4.48% in Jun 2026",
        "dir": -1
      },
      {
        "prefix": "Consolidated Net Profit ",
        "suffix": "QoQ Growth in quarter ended Sep 2026 is -1.93% vs 139.98% in Jun 2026",
        "dir": -1
      }
    ],
    "table": {
      "header": [
        "Sep'26",
        "Jun'26",
        "Change(%)"
      ],
      "body": [
        {
          "field": "Net Sales",
          "val1": "274.68",
          "val2": "293.83",
          "chgp": "-6.52%",
          "chgp_class": "negative"
        },
        {
          "field": "Operating Profit (PBDIT) excl Other Income",
          "val1": "36.46",
          "val2": "42.41",
          "chgp": "-14.03%",
          "chgp_class": "negative"
        },
        {
          "field": "Interest",
          "val1": "0.84",
          "val2": "0.59",
          "chgp": "42.37%",
          "chgp_class": "negative"
        },
        {
          "field": "Exceptional Items",
          "val1": "0.00",
          "val2": "0.00",
          "chgp": "",
          "chgp_class": "neutral"
        },
        {
          "field": "Consolidate Net Profit",
          "val1": "28.90",
          "val2": "29.47",
          "chgp": "-1.93%",
          "chgp_class": "negative"
        },
        {
          "field": "Operating Profit Margin (Excl OI)",
          "val1": "13.27%",
          "val2": "14.43%",
          "chgp": "-1.16%",
          "chgp_class": "negative"
        }
      ]
    }
  },
  {
    "link": "half-yearly",
    "btn_text": "All Half Yearly Results",
    "header": "Half Yearly Results Snapshot (Consolidated) - Sep'25",
    "rhs": [
      {
        "prefix": "Net Sales ",
        "suffix": " Growth in half year ended Sep 2025 is 8.60% vs 29.46% in Sep 2024",
        "dir": -1
      },
      {
        "prefix": "Consolidated Net Profit ",
        "suffix": " Growth in half year ended Sep 2025 is -17.62% vs 770.76% in Sep 2024",
        "dir": -1
      }
    ],
    "table": {
      "header": [
        "Sep'25",
        "Sep'24",
        "Change(%)"
      ],
      "body": [
        {
          "field": "Net Sales",
          "val1": "579.75",
          "val2": "533.82",
          "chgp": "8.60%",
          "chgp_class": "positive"
        },
        {
          "field": "Operating Profit (PBDIT) excl Other Income",
          "val1": "72.12",
          "val2": "87.93",
          "chgp": "-17.98%",
          "chgp_class": "negative"
        },
        {
          "field": "Interest",
          "val1": "1.76",
          "val2": "1.82",
          "chgp": "-3.30%",
          "chgp_class": "positive"
        },
        {
          "field": "Exceptional Items",
          "val1": "0.00",
          "val2": "0.00",
          "chgp": "",
          "chgp_class": "neutral"
        },
        {
          "field": "Consolidate Net Profit",
          "val1": "54.95",
          "val2": "66.70",
          "chgp": "-17.62%",
          "chgp_class": "negative"
        },
        {
          "field": "Operating Profit Margin (Excl OI)",
          "val1": "12.44%",
          "val2": "16.47%",
          "chgp": "-4.03%",
          "chgp_class": "negative"
        }
      ]
    }
  },
  {
    "link": "nine-monthly",
    "btn_text": "All Nine Monthly Results",
    "header": "Nine Monthly Results Snapshot (Consolidated) - Dec'25",
    "rhs": [
      {
        "prefix": "Net Sales ",
        "suffix": "YoY Growth in nine months ended Dec 2025 is 11.37% vs 23.22% in Dec 2024",
        "dir": -1
      },
      {
        "prefix": "Consolidated Net Profit ",
        "suffix": "YoY Growth in nine months ended Dec 2025 is -13.05% vs 605.03% in Dec 2024",
        "dir": -1
      }
    ],
    "table": {
      "header": [
        "Dec'25",
        "Dec'24",
        "Change(%)"
      ],
      "body": [
        {
          "field": "Net Sales",
          "val1": "813.29",
          "val2": "730.23",
          "chgp": "11.37%",
          "chgp_class": "positive"
        },
        {
          "field": "Operating Profit (PBDIT) excl Other Income",
          "val1": "87.87",
          "val2": "100.01",
          "chgp": "-12.14%",
          "chgp_class": "negative"
        },
        {
          "field": "Interest",
          "val1": "2.21",
          "val2": "2.10",
          "chgp": "5.24%",
          "chgp_class": "negative"
        },
        {
          "field": "Exceptional Items",
          "val1": "0.00",
          "val2": "0.00",
          "chgp": "",
          "chgp_class": "neutral"
        },
        {
          "field": "Consolidate Net Profit",
          "val1": "63.39",
          "val2": "72.90",
          "chgp": "-13.05%",
          "chgp_class": "negative"
        },
        {
          "field": "Operating Profit Margin (Excl OI)",
          "val1": "10.80%",
          "val2": "13.70%",
          "chgp": "-2.90%",
          "chgp_class": "negative"
        }
      ]
    }
  },
  {
    "link": "annual",
    "btn_text": "All Annual Results",
    "header": "Annual Results Snapshot (Consolidated) - Mar'26",
    "rhs": [
      {
        "prefix": "Net Sales ",
        "suffix": "YoY Growth in year ended Mar 2026 is 11.91% vs 18.39% in Mar 2025",
        "dir": -1
      },
      {
        "prefix": "Consolidated Net Profit ",
        "suffix": "YoY Growth in year ended Mar 2026 is -11.30% vs 401.53% in Mar 2025",
        "dir": -1
      }
    ],
    "table": {
      "header": [
        "Mar'26",
        "Mar'25",
        "Change(%)"
      ],
      "body": [
        {
          "field": "Net Sales",
          "val1": "1,094.52",
          "val2": "978.07",
          "chgp": "11.91%",
          "chgp_class": "positive"
        },
        {
          "field": "Operating Profit (PBDIT) excl Other Income",
          "val1": "109.84",
          "val2": "119.57",
          "chgp": "-8.14%",
          "chgp_class": "negative"
        },
        {
          "field": "Interest",
          "val1": "2.47",
          "val2": "2.37",
          "chgp": "4.22%",
          "chgp_class": "negative"
        },
        {
          "field": "Exceptional Items",
          "val1": "0.00",
          "val2": "0.00",
          "chgp": "",
          "chgp_class": "neutral"
        },
        {
          "field": "Consolidate Net Profit",
          "val1": "75.67",
          "val2": "85.31",
          "chgp": "-11.30%",
          "chgp_class": "negative"
        },
        {
          "field": "Operating Profit Margin (Excl OI)",
          "val1": "10.04%",
          "val2": "12.23%",
          "chgp": "-2.19%",
          "chgp_class": "negative"
        }
      ]
    }
  }
]
Quarterly Results Snapshot (Consolidated) - Sep'26 - QoQstock-summary
Sep'26
Jun'26
Change(%)
Net Sales
274.68
293.83
-6.52%
Operating Profit (PBDIT) excl Other Income
36.46
42.41
-14.03%
Interest
0.84
0.59
42.37%
Exceptional Items
0.00
0.00
Consolidate Net Profit
28.90
29.47
-1.93%
Operating Profit Margin (Excl OI)
13.27%
14.43%
-1.16%
Values in Rs Cr.
Direction Arrows
Net Sales

QoQ Growth in quarter ended Sep 2026 is -6.52% vs 4.48% in Jun 2026

Direction Arrows
Consolidated Net Profit

QoQ Growth in quarter ended Sep 2026 is -1.93% vs 139.98% in Jun 2026

Half Yearly Results Snapshot (Consolidated) - Sep'25stock-summary
Sep'25
Sep'24
Change(%)
Net Sales
579.75
533.82
8.60%
Operating Profit (PBDIT) excl Other Income
72.12
87.93
-17.98%
Interest
1.76
1.82
-3.30%
Exceptional Items
0.00
0.00
Consolidate Net Profit
54.95
66.70
-17.62%
Operating Profit Margin (Excl OI)
12.44%
16.47%
-4.03%
Values in Rs Cr.
Direction Arrows
Net Sales

Growth in half year ended Sep 2025 is 8.60% vs 29.46% in Sep 2024

Direction Arrows
Consolidated Net Profit

Growth in half year ended Sep 2025 is -17.62% vs 770.76% in Sep 2024

Nine Monthly Results Snapshot (Consolidated) - Dec'25stock-summary
Dec'25
Dec'24
Change(%)
Net Sales
813.29
730.23
11.37%
Operating Profit (PBDIT) excl Other Income
87.87
100.01
-12.14%
Interest
2.21
2.10
5.24%
Exceptional Items
0.00
0.00
Consolidate Net Profit
63.39
72.90
-13.05%
Operating Profit Margin (Excl OI)
10.80%
13.70%
-2.90%
Values in Rs Cr.
Direction Arrows
Net Sales

YoY Growth in nine months ended Dec 2025 is 11.37% vs 23.22% in Dec 2024

Direction Arrows
Consolidated Net Profit

YoY Growth in nine months ended Dec 2025 is -13.05% vs 605.03% in Dec 2024

Annual Results Snapshot (Consolidated) - Mar'26stock-summary
Mar'26
Mar'25
Change(%)
Net Sales
1,094.52
978.07
11.91%
Operating Profit (PBDIT) excl Other Income
109.84
119.57
-8.14%
Interest
2.47
2.37
4.22%
Exceptional Items
0.00
0.00
Consolidate Net Profit
75.67
85.31
-11.30%
Operating Profit Margin (Excl OI)
10.04%
12.23%
-2.19%
Values in Rs Cr.
Direction Arrows
Net Sales

YoY Growth in year ended Mar 2026 is 11.91% vs 18.39% in Mar 2025

Direction Arrows
Consolidated Net Profit

YoY Growth in year ended Mar 2026 is -11.30% vs 401.53% in Mar 2025

stock-summaryCompany CV
About Excel Industries Ltd stock-summary
stock-summary
Excel Industries Ltd
Micro Cap
Specialty Chemicals
Excel Industries, incorporated in 1960 is part of A C Shroff's Excel Group and is into manufacture of industrial chemicals, speciality chemicals, bio-fertilisers and bio-remediation technologies. As part of its restructuring plan the company has divested its Agri business(Pesticides) to Excel Crop Care Ltd(erstwhile West Coast Oxygen Ltd), a group company w.e.f April 1, 2002. Global Pesticide major Nufam of Australia is expected to pick up a sizeable stake in the Excel Crop Care Ltd.
Company Coordinates stock-summary
Company Details
184-87 Swami Vivekanand Road, Jogeshwari (West) Mumbai Maharashtra : 400102
stock-summary
Tel: 91-22-66464200
stock-summary
excel.mumbai@excelind.com
Registrar Details
Link Intime India Pvt Ltd, C-13 Pannalal Silk Compound, L B S Marg, Bhandup , Mumbai