
 Score
Dashboard
With a Negative Book Value, the company has a Weak Long Term Fundamental Strength
- Poor long term growth as Operating profit has grown by an annual rate -7.97% of over the last 5 years
- Low ability to service debt as the company has a high Debt to EBITDA ratio of -1.00 times
Negative results in Jun 26
Risky - Negative EBITDA
Underperformed the market in the last 1 year
Mojo ParametersStock DNA

Garments & Apparels

INR 7 Cr (Micro Cap)

NA (Loss Making)
24

0.00%

-1.02

7.09%

-5.68
Total ReturnsTotal Returns (Price + Dividend) 
Eureka Industrie for the last several years.
Risk Adjusted Returns v/s
Returns Beta
 News & Corporate Actions
News
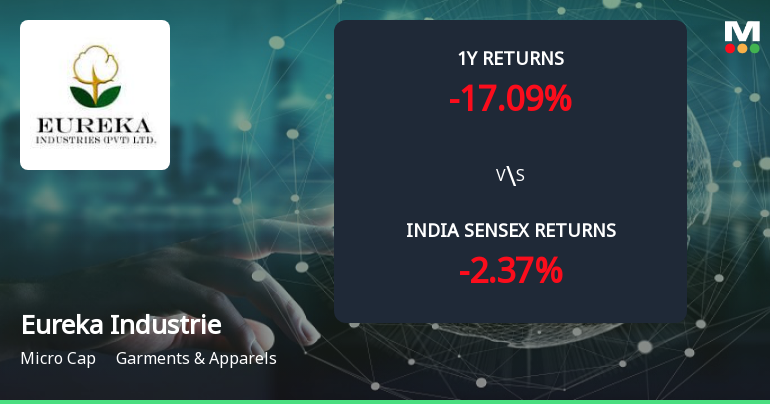
Eureka Industries Ltd Forms Golden Cross Amid Mixed Technical Signals and Micro-Cap Challenges
The 50-day moving average for Eureka Industries Ltd has crossed above the 200-day moving average, creating a golden cross on 11 Nov 2026. While this technical event often signals a shift towards bullish momentum, the broader technical and fundamental context for this micro-cap garment company presents a more nuanced picture.
Read More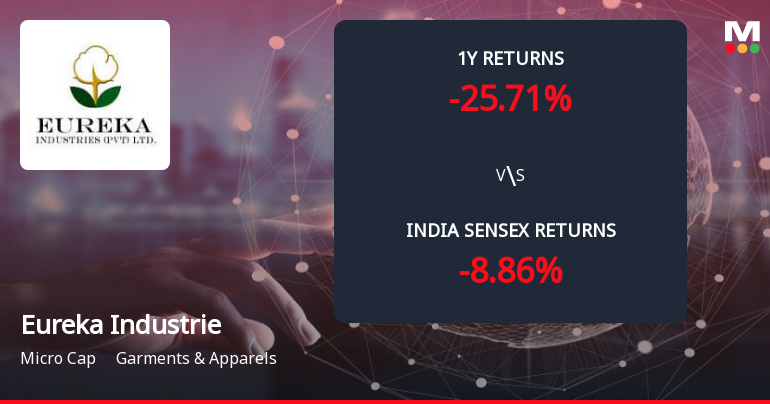
Eureka Industries Ltd Forms Death Cross, Signalling Bearish Trend Ahead
Eureka Industries Ltd, a micro-cap player in the Garments & Apparels sector, has recently formed a Death Cross, a significant technical indicator where the 50-day moving average crosses below the 200-day moving average. This development signals a potential shift towards a sustained bearish trend, reflecting deteriorating momentum and long-term weakness in the stock’s price action.
Read More Announcements
Closure of Trading Window
01-Oct-2026 | Source : BSEAs Attached Herewith
Announcement under Regulation 30 (LODR)-Resignation of Company Secretary / Compliance Officer
07-Sep-2026 | Source : BSEResignation of Company Secretary and Compliance officer
Announcement under Regulation 30 (LODR)-Cessation
07-Sep-2026 | Source : BSEResignaiton of Company Secretary and Compliance officer
Corporate Actions

No Upcoming Board Meetings

No Dividend history available

No Splits history available

No Bonus history available

Eureka Industries Ltd has announced 28:5 rights issue, ex-date: 28 Mar 25
Key FactorsQuality key factors
Valuation key factors
Technicals key factors
 Technical Indicator Scale: Bearish, Mildly Bearish, Sideways, Mildly Bullish, Bullish Turned Shareholding
Shareholding Snapshot : Jun 2026
Shareholding Compare (%holding)
Non Institution
None
Held by 0 Schemes
Held by 0 FIIs
None
Sonam Goyal (8.67%)
86.38%
FinancialQuarterly Results Snapshot (Standalone) - Jun'26 - YoY
 Compare with Peers

YoY Growth in quarter ended Jun 2026 is -99.89% vs 1,289.26% in Jun 2025
YoY Growth in quarter ended Jun 2026 is -362.50% vs -80.49% in Jun 2025

Half Yearly Results Snapshot (Standalone) - Sep'25

Growth in half year ended Sep 2025 is 551.56% vs 94.68% in Sep 2024
Growth in half year ended Sep 2025 is -62.50% vs 980.00% in Sep 2024
Nine Monthly Results Snapshot (Standalone) - Dec'25
YoY Growth in nine months ended Dec 2025 is 118.38% vs 288.39% in Dec 2024
YoY Growth in nine months ended Dec 2025 is -58.68% vs 178.77% in Dec 2024
Annual Results Snapshot (Standalone) - Mar'26
YoY Growth in year ended Mar 2026 is 46.67% vs 343.22% in Mar 2025
YoY Growth in year ended Mar 2026 is -90.65% vs 146.93% in Mar 2025
 Company CV
About Eureka Industries Ltd

Company Coordinates


