Elgi Rubber Co

  • Market Cap: Micro Cap
  • Industry: Industrial Products
  • ISIN: INE819L01012
  • NSEID: ELGIRUBCO
  • BSEID: 500471
INR
8.79
0.00 (0.00%)
BSENSE

Nov 20

BSE+NSE Vol: 22.89 k

  • Price Points
  • Score
  • Mojo Parameters
  • Total Return
  • News and Corporate Actions
  • Key factors
  • Shareholding
  • Financials
  • CompanyCV
stock-summaryPrice Point
High/Low

1Day

52 Week

Valuation
Technical
Day's Volume

CASH

22.89 k (-42.76%) Volume

Shareholding (Sep 2026)

FII

0.00%

Held by 1 FIIs

DII

3.30%

Held by 2 DIIs

Promoter

65.03%

Who are the top shareholders of the Elgi Rubber Co?

06-Jun-2025

The top shareholder of Elgi Rubber Co is Sudarsan Varadaraj, holding 47.09%, with Tamilnadu Industrial Investment Corporation Limited as the largest public shareholder at 2.36%. Individual investors own 24.52%, while mutual funds and foreign institutional investors hold 0.0%.

The top shareholders of Elgi Rubber Co include the promoters, with Sudarsan Varadaraj holding the highest stake at 47.09%. The company does not have any pledged promoter holdings. In terms of public shareholders, Tamilnadu Industrial Investment Corporation Limited is the largest, holding 2.36%. Additionally, individual investors collectively own 24.52% of the company. There are also two mutual fund schemes and three foreign institutional investors, but they hold 0.0% of the shares.

Read More

When is the next results date for Elgi Rubber Co?

06-Jun-2025

No Upcoming Board Meetings

What does Elgi Rubber Co do?

06-Jun-2025

Elgi Rubber Company Ltd specializes in manufacturing reclaimed rubber, retreading machinery, and retreading rubber, and is a pioneer in Pre-cured Retreading technology in India. As of March 2025, it reported net sales of 97 Cr and a net loss of 17 Cr, with a market cap of Rs 340 Cr.

Overview: <BR>Elgi Rubber Company Ltd is a leading solutions provider in the Rubber Industry, specializing in the manufacturing of reclaimed rubber, retreading machinery, and retreading rubber, and operates within the Micro Cap market segment.<BR><BR>History: <BR>Elgi Rubber Company Ltd was incorporated on 16 October 2006 in Coimbatore. The company has established itself as a pioneer in Pre-cured Retreading technology and has the largest franchise network in India. The latest quarterly results reported net sales and net profit for the period ending March 2025.<BR><BR>Financial Snapshot: <BR>Most recent Net Sales: 97 Cr (Quarterly Results - Mar 2025) <BR>Most recent Net Profit: -17 Cr (Quarterly Results - Mar 2025) <BR>Market-cap value: Rs 340 Cr (Micro Cap)<BR><BR>Key Metrics: <BR>P/E: N/A <BR>Industry P/E: 24 <BR>Dividend Yield: 0.00% <BR>Debt-Equity: 1.15 <BR>Return on Equity: -2.37% <BR>Price to Book: 1.62 <BR><BR>Contact Details: <BR>Address: 2000 Trichy Road, Singanallur Coimbatore Tamil Nadu : 641005 <BR>Tel: 91-0422-2321000 <BR>Email: info@in.elgirubber.com <BR>Website: http://www.elgirubber.com

Read More

Who are in the management team of Elgi Rubber Co?

06-Jun-2025

As of March 2023, the management team of Elgi Rubber Co includes Sudarsan Varadaraj (Chairman & Managing Director), Jairam Varadaraj, M D Selvaraj, P Vijay Raghunath, and R Bhuvaneshwari, all serving as Non Executive Directors. They collectively guide the company's governance and strategic direction.

As of March 2023, the management team of Elgi Rubber Co includes the following individuals:<BR><BR>1. Sudarsan Varadaraj - Chairman & Managing Director<BR>2. Jairam Varadaraj - Non Executive Director<BR>3. M D Selvaraj - Non Executive Director<BR>4. P Vijay Raghunath - Non Executive Director<BR>5. R Bhuvaneshwari - Non Executive Director<BR><BR>Each member plays a significant role in the governance and strategic direction of the company.

Read More

Has Elgi Rubber Co declared dividend?

06-Jun-2025

Elgi Rubber Company Ltd has declared a 16% dividend, amounting to ₹0.16 per share, with an ex-date of March 18, 2020. Despite this, the dividend yield is 0%, and total returns have varied significantly, with a 297.3% return over the past 5 years but recent declines in shorter periods.

Elgi Rubber Company Ltd has declared a 16% dividend.<BR><BR>Dividend Details:<BR>- Percentage announced: 16%<BR>- Amount per share: 0.16<BR>- Ex-date: 18 Mar 20<BR><BR>Dividend Yield: 0%<BR><BR>Total Returns by Period:<BR>In the last 6 months, the price return was -55.69%, with a dividend return of 0%, resulting in a total return of -55.69%.<BR><BR>Over the past year, the price return was -18.39%, with a dividend return of 0%, leading to a total return of -18.39%.<BR><BR>In the 2-year period, the price return was 54.74%, with a dividend return of 0%, culminating in a total return of 54.74%.<BR><BR>For the 3-year period, the price return was 82.61%, with a dividend return of 0%, resulting in a total return of 82.61%.<BR><BR>In the last 4 years, the price return was 57.22%, with a dividend return of 0%, leading to a total return of 57.22%.<BR><BR>Over the past 5 years, the price return was 297.3%, with a dividend return of 0%, culminating in a total return of 297.3%.<BR><BR>Overall, Elgi Rubber Company Ltd has declared a dividend, but the dividend yield remains at 0%. The total returns over various periods show significant fluctuations, particularly a strong performance over the 5-year period despite recent declines in shorter time frames.

Read More

Who are the peers of the Elgi Rubber Co?

03-Jun-2025

Elgi Rubber Co's peers include Timken India, SKF India, Grindwell Norton, Carborundum Uni., and others. While Timken India and SKF India show excellent management risk and capital structure, Elgi Rubber Co has a below-average capital structure and a 1-year return of 0.00%, underperforming compared to its peers.

Peers: The peers of Elgi Rubber Co are Timken India, SKF India, Grindwell Norton, Carborundum Uni., Borosil Renew., Galaxy Bearings, Century Extrus., Shilp Gravures, Gayatri Rubbers, and Agarwal Toughene.<BR><BR>Quality Snapshot: Excellent management risk is observed at SKF India, while Good management risk is found at Timken India, Grindwell Norton, Carborundum Uni., Galaxy Bearings, and Agarwal Toughene, and the rest have Average or Below Average management risk. Below Average growth is seen in Timken India, SKF India, Grindwell Norton, Carborundum Uni., Century Extrus., and Shilp Gravures, while Good growth is noted at Gayatri Rubbers and Agarwal Toughene, with the rest showing Below Average growth. Excellent capital structure is present in Timken India, SKF India, Grindwell Norton, Carborundum Uni., Galaxy Bearings, and Shilp Gravures, while Average capital structure is found at Borosil Renew., and Below Average capital structure is observed in Century Extrus., Gayatri Rubbers, Agarwal Toughene, and Elgi Rubber Co.<BR><BR>Return Snapshot: Timken India has the highest 1-year return at -20.59%, while Carborundum Uni. has the lowest at -40.74%, with Elgi Rubber Co's 1-year return at 0.00%, indicating it does not compare favorably to its peers. Additionally, the six-month return is negative for Timken India, SKF India, Grindwell Norton, Carborundum Uni., Galaxy Bearings, Century Extrus., and Elgi Rubber Co.

Read More

Is Elgi Rubber Co overvalued or undervalued?

09-Jun-2025

As of May 30, 2025, Elgi Rubber Co is considered overvalued and risky due to its negative PE ratio of -15.87, high EV to EBITDA ratio of 88.16, negative returns on capital and equity, and a year-to-date stock decline of 57.56%, significantly underperforming compared to its peers and the market.

As of 30 May 2025, Elgi Rubber Co's valuation grade has moved from attractive to risky, indicating a significant deterioration in its financial standing. The company appears to be overvalued given its negative PE ratio of -15.87 and an EV to EBITDA ratio of 88.16, which are starkly unfavorable compared to its peers. The Price to Book Value stands at 1.62, suggesting that the market is pricing the company above its book value despite its poor performance metrics.<BR><BR>In comparison to its peers, Elgi Rubber Co's ratios are concerning; for instance, Cupid has a PE of 70.91 and an EV to EBITDA of 44.50, while Pix Transmission is at 19.3 and 13.43, respectively. Notably, Elgi's ROCE and ROE are also negative at -0.79% and -2.37%, further emphasizing its struggles. The company's recent stock performance has been disappointing, with a year-to-date return of -57.56%, contrasting sharply with the Sensex's gain of 6.22% during the same period. This combination of factors leads to the conclusion that Elgi Rubber Co is overvalued in the current market environment.

Read More

What is the technical trend for Elgi Rubber Co?

09-Jun-2025

As of July 28, 2020, Elgi Rubber Co's stock price of 57.74 is significantly below its 52-week high and has a negative year-to-date return of -57.56%, indicating a bearish sentiment and a neutral technical stance due to insufficient data for a clear classification.

As of 28 July 2020, the technical trend for Elgi Rubber Co does not qualify. The current price is 57.74, which is significantly below the 52-week high of 154.98 and closer to the 52-week low of 51.98. The stock has shown a negative return of -57.56% year-to-date, while the Sensex has gained 6.17% in the same period. The recent performance indicates bearish sentiment, particularly with a 1-week return of -5.75%. Overall, the lack of qualifying technical indicators suggests a neutral stance due to insufficient data for a definitive bullish or bearish classification.

Read More

How big is Elgi Rubber Co?

24-Jul-2025

As of 23rd July, Elgi Rubber Company Ltd has a market capitalization of 305.00 Cr and reported net sales of 383.92 Cr, with a net loss of 4.37 Cr in the latest four quarters. The balance sheet for March 2025 shows shareholder's funds of 179.09 Cr and total assets of 492.60 Cr.

As of 23rd July, Elgi Rubber Company Ltd has a market capitalization of 305.00 Cr, categorizing it as a Micro Cap company.<BR><BR>In the latest four quarters, the company reported net sales of 383.92 Cr. However, it experienced a loss of 4.37 Cr in net profit during the same period.<BR><BR>The latest annual period for the balance sheet is March 2025, showing shareholder's funds of 179.09 Cr and total assets of 492.60 Cr.

Read More

How has been the historical performance of Elgi Rubber Co?

14-Nov-2025

Elgi Rubber Co has experienced fluctuating financial performance, with net sales declining from 394.50 Cr in Mar'23 to 383.92 Cr in Mar'25, and a significant drop in profitability, resulting in a profit after tax of -4.36 Cr in Mar'25 compared to 11.66 Cr in Mar'24. Total liabilities and assets also decreased during this period, indicating a downward trend in overall financial health.

Answer:<BR>The historical performance of Elgi Rubber Co shows a fluctuating trend in key financial metrics over the past several years.<BR><BR>Breakdown:<BR>Elgi Rubber Co's net sales have seen a decline from 394.50 Cr in Mar'23 to 383.92 Cr in Mar'25, with a peak of 409.85 Cr in Mar'19. The total operating income followed a similar pattern, decreasing from 394.50 Cr in Mar'23 to 383.92 Cr in Mar'25. Raw material costs have also decreased slightly from 177.44 Cr in Mar'23 to 164.94 Cr in Mar'25. Operating profit (PBDIT) has varied, peaking at 47.30 Cr in Mar'24 before dropping to 22.52 Cr in Mar'25. The profit before tax turned negative in Mar'25 at -4.51 Cr, contrasting with a profit of 13.71 Cr in Mar'24. Consequently, the profit after tax also fell to -4.36 Cr in Mar'25 from 11.66 Cr in Mar'24. Total liabilities decreased from 539.20 Cr in Mar'24 to 492.60 Cr in Mar'25, while total assets also declined from 539.20 Cr to 492.60 Cr in the same period. Cash flow from operating activities decreased to 6.00 Cr in Mar'24 from 26.00 Cr in Mar'23, indicating a downward trend in cash generation. Overall, Elgi Rubber Co has experienced significant fluctuations in its financial performance, with a notable decline in profitability and sales in the latest fiscal year.

Read More

Should I buy, sell or hold Elgi Rubber Co?

16-Nov-2025

Why is Elgi Rubber Co falling/rising?

03-Dec-2025

As of 03-Dec, Elgi Rubber Company Ltd's stock price is at Rs 52.45, reflecting a decline of 2.05%. The stock has underperformed significantly, with a year-to-date drop of 61.45% and a consistent downward trend, trading below its moving averages and showing weak demand.

As of 03-Dec, Elgi Rubber Company Ltd's stock price is falling, currently at Rs 52.45, which reflects a decrease of Rs 1.1 or 2.05%. The stock has been underperforming significantly, having fallen for the last two consecutive days, resulting in a total decline of 6.95% during this period. Additionally, the stock has experienced a weekly decline for the past eight weeks, with a total return of -100% in that timeframe. Over the last month, the stock has consistently fallen, generating -100% returns as well.<BR><BR>The stock's performance is notably poor when compared to the benchmark Sensex, which has shown a positive return of 0.86% over the past month. Year-to-date, Elgi Rubber's stock has plummeted by 61.45%, while the Sensex has gained 9.90%. Furthermore, the stock is trading below its moving averages across various time frames, indicating a persistent downward trend. The stock's liquidity is also a concern, as it has not traded on five out of the last twenty days, and a significant volume was traded close to its low price of Rs 51.52, which is indicative of weak demand. Overall, these factors contribute to the ongoing decline in Elgi Rubber Company's stock price.

Read More
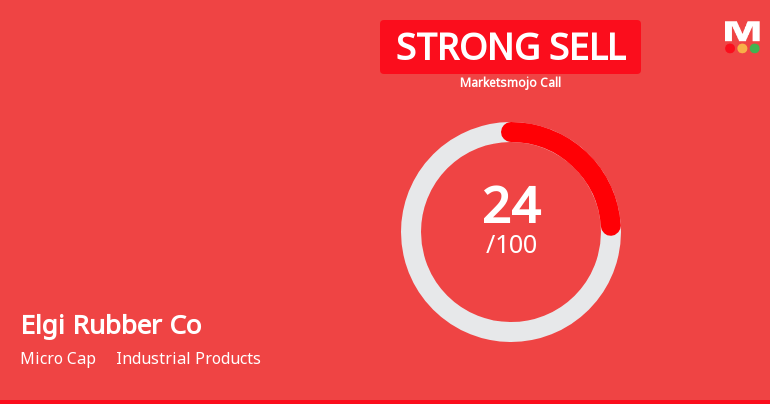
iScoreScore
Click here to find our call on this stock
Strong Sell
Sell
Hold
Buy
Strong Buy
Dashboard
1

Weak Long Term Fundamental Strength with a -310.62% CAGR growth in Operating Profits over the last 5 years

  • Low ability to service debt as the company has a high Debt to EBITDA ratio of -1.00 times
  • The company has been able to generate a Return on Equity (avg) of 1.10% signifying low profitability per unit of shareholders funds
2

Risky - Negative EBITDA

stock-summaryMojo Parameters
Mojo Parameters
Loading Valuation Snapshot...
Stock DNA
stock-summary
Industry

Industrial Products

stock-summary
Market cap

INR Cr (Micro Cap)

stock-summary
P/E

NA (Loss Making)

stock-summary
Industry P/E

24

stock-summary
Dividend Yield

0.00%

stock-summary
Debt Equity

0.00

stock-summary
Return on Equity

0.00%

stock-summary
Price to Book

0.00

Revenue and Profits:
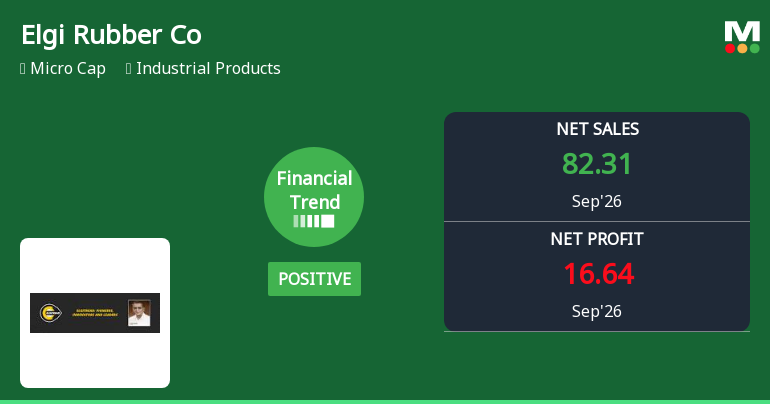
Net Sales:
82 Cr
(Quarterly Results - Sep 2026)
Net Profit:
17 Cr
stock-summaryTotal Returns
Total Returns (Price + Dividend) stock-summary
Icon
Company does not have enough history
Risk Adjusted Returns v/s stock-summary
Returns Beta
Icon
Beta has not been calculated since enough price history is not available
stock-summaryNews & Corporate Actions
News
Announcements stock-summary

Elgi Rubber Company to convene AGM

29-May-2023 | Source : BSE

Elgi Rubber Company announced that the 17th Annual General Meeting (AGM) of the company will be held on 18 August 2023.

Elgi Rubber Company to conduct board meeting

18-May-2023 | Source : BSE

Elgi Rubber Company will hold a meeting of the Board of Directors of the Company on 25 May 2023.

Elgi Rubber Company to declare Quarterly Result

01-Nov-2022 | Source : BSE

Elgi Rubber Company will hold a meeting of the Board of Directors of the Company on 10 November 2022.

Corporate Actions stock-summary
stock-summary
BOARD MEETING

No Upcoming Board Meetings

stock-summary
DIVIDEND

Elgi Rubber Company Ltd has declared 16% dividend, ex-date: 18 Mar 20

stock-summary
SPLITS

No Splits history available

stock-summary
BONUS

No Bonus history available

stock-summary
RIGHTS

No Rights history available

stock-summaryKey Factors
Quality key factors stock-summary
Factor
Value
Sales Growth (5y)
-1.29%
EBIT Growth (5y)
-310.62%
EBIT to Interest (avg)
-0.63
Debt to EBITDA (avg)
Negative Net Debt
Net Debt to Equity (avg)
1.75
Sales to Capital Employed (avg)
0.86
Tax Ratio
2.72%
Dividend Payout Ratio
0
Pledged Shares
21.51%
Institutional Holding
3.30%
ROCE (avg)
-5.06%
ROE (avg)
1.10%
Valuation key factors
Factor
Value
P/E Ratio
NA (Loss Making)
Industry P/E
24
Price to Book Value
1.97
EV to EBIT
-6.84
EV to EBITDA
-8.89
EV to Capital Employed
1.35
EV to Sales
1.47
PEG Ratio
NA
Dividend Yield
NA
ROCE (Latest)
-19.75%
ROE (Latest)
-52.39%
Technicals key factors
Indicator
Weekly
Monthly
Icon
Technical indicator has not been calculated since the stock has been active for a short period
stock-summary Technical Indicator Scale: Bearish, Mildly Bearish, Sideways, Mildly Bullish, Bullish  Turned 
stock-summaryShareholding
Shareholding Snapshot : Sep 2026stock-summary
Shareholding Compare (%holding) stock-summary
Majority shareholders

Promoters

Pledged Promoter Holdings

21.5055

Mutual Funds

Held by 2 Schemes (0.0%)

FIIs

Held by 1 FIIs (0.0%)

Promoter with highest holding

Sudarsan Varadaraj (47.09%)

Highest Public shareholder

Tamilnadu Industrial Investment Corporation Limited (2.36%)

Individual Investors Holdings

25.18%

stock-summaryFinancial
[
  {
    "link": "quarterly",
    "btn_text": "All Quarterly Results",
    "header": "Quarterly Results Snapshot (Consolidated) - Sep'26 - QoQ",
    "rhs": [
      {
        "prefix": "Net Sales ",
        "suffix": "QoQ Growth in quarter ended Sep 2026 is 17.43% vs -18.82% in Jun 2026",
        "dir": 1
      },
      {
        "prefix": "Consolidated Net Profit ",
        "suffix": "QoQ Growth in quarter ended Sep 2026 is -59.27% vs 120.02% in Jun 2026",
        "dir": -1
      }
    ],
    "table": {
      "header": [
        "Sep'26",
        "Jun'26",
        "Change(%)"
      ],
      "body": [
        {
          "field": "Net Sales",
          "val1": "82.31",
          "val2": "70.09",
          "chgp": "17.43%",
          "chgp_class": "positive"
        },
        {
          "field": "Operating Profit (PBDIT) excl Other Income",
          "val1": "6.22",
          "val2": "2.61",
          "chgp": "138.31%",
          "chgp_class": "positive"
        },
        {
          "field": "Interest",
          "val1": "6.57",
          "val2": "7.80",
          "chgp": "-15.77%",
          "chgp_class": "positive"
        },
        {
          "field": "Exceptional Items",
          "val1": "10.90",
          "val2": "43.26",
          "chgp": "-74.80%",
          "chgp_class": "negative"
        },
        {
          "field": "Consolidate Net Profit",
          "val1": "16.64",
          "val2": "40.85",
          "chgp": "-59.27%",
          "chgp_class": "negative"
        },
        {
          "field": "Operating Profit Margin (Excl OI)",
          "val1": "7.56%",
          "val2": "3.72%",
          "chgp": "3.84%",
          "chgp_class": "positive"
        }
      ]
    }
  },
  {
    "link": "half-yearly",
    "btn_text": "All Half Yearly Results",
    "header": "Half Yearly Results Snapshot (Consolidated) - Sep'25",
    "rhs": [
      {
        "prefix": "Net Sales ",
        "suffix": " Growth in half year ended Sep 2025 is -7.76% vs -0.73% in Sep 2024",
        "dir": -1
      },
      {
        "prefix": "Consolidated Net Profit ",
        "suffix": " Growth in half year ended Sep 2025 is -146.53% vs 5.76% in Sep 2024",
        "dir": -1
      }
    ],
    "table": {
      "header": [
        "Sep'25",
        "Sep'24",
        "Change(%)"
      ],
      "body": [
        {
          "field": "Net Sales",
          "val1": "180.07",
          "val2": "195.22",
          "chgp": "-7.76%",
          "chgp_class": "negative"
        },
        {
          "field": "Operating Profit (PBDIT) excl Other Income",
          "val1": "3.32",
          "val2": "10.88",
          "chgp": "-69.49%",
          "chgp_class": "negative"
        },
        {
          "field": "Interest",
          "val1": "13.24",
          "val2": "10.17",
          "chgp": "30.19%",
          "chgp_class": "negative"
        },
        {
          "field": "Exceptional Items",
          "val1": "0.53",
          "val2": "15.08",
          "chgp": "-96.49%",
          "chgp_class": "negative"
        },
        {
          "field": "Consolidate Net Profit",
          "val1": "-7.52",
          "val2": "16.16",
          "chgp": "-146.53%",
          "chgp_class": "negative"
        },
        {
          "field": "Operating Profit Margin (Excl OI)",
          "val1": "1.84%",
          "val2": "5.57%",
          "chgp": "-3.73%",
          "chgp_class": "negative"
        }
      ]
    }
  },
  {
    "link": "nine-monthly",
    "btn_text": "All Nine Monthly Results",
    "header": "Nine Monthly Results Snapshot (Consolidated) - Dec'25",
    "rhs": [
      {
        "prefix": "Net Sales ",
        "suffix": "YoY Growth in nine months ended Dec 2025 is -2.28% vs -1.60% in Dec 2024",
        "dir": -1
      },
      {
        "prefix": "Consolidated Net Profit ",
        "suffix": "YoY Growth in nine months ended Dec 2025 is -385.86% vs -5.24% in Dec 2024",
        "dir": -1
      }
    ],
    "table": {
      "header": [
        "Dec'25",
        "Dec'24",
        "Change(%)"
      ],
      "body": [
        {
          "field": "Net Sales",
          "val1": "280.16",
          "val2": "286.70",
          "chgp": "-2.28%",
          "chgp_class": "negative"
        },
        {
          "field": "Operating Profit (PBDIT) excl Other Income",
          "val1": "-20.22",
          "val2": "21.07",
          "chgp": "-195.97%",
          "chgp_class": "negative"
        },
        {
          "field": "Interest",
          "val1": "24.97",
          "val2": "17.59",
          "chgp": "41.96%",
          "chgp_class": "negative"
        },
        {
          "field": "Exceptional Items",
          "val1": "0.31",
          "val2": "15.17",
          "chgp": "-97.96%",
          "chgp_class": "negative"
        },
        {
          "field": "Consolidate Net Profit",
          "val1": "-36.19",
          "val2": "12.66",
          "chgp": "-385.86%",
          "chgp_class": "negative"
        },
        {
          "field": "Operating Profit Margin (Excl OI)",
          "val1": "-7.22%",
          "val2": "7.35%",
          "chgp": "-14.57%",
          "chgp_class": "negative"
        }
      ]
    }
  },
  {
    "link": "annual",
    "btn_text": "All Annual Results",
    "header": "Annual Results Snapshot (Consolidated) - Mar'26",
    "rhs": [
      {
        "prefix": "Net Sales ",
        "suffix": "YoY Growth in year ended Mar 2026 is -4.54% vs -0.65% in Mar 2025",
        "dir": -1
      },
      {
        "prefix": "Consolidated Net Profit ",
        "suffix": "YoY Growth in year ended Mar 2026 is -5,410.09% vs -137.39% in Mar 2025",
        "dir": -1
      }
    ],
    "table": {
      "header": [
        "Mar'26",
        "Mar'25",
        "Change(%)"
      ],
      "body": [
        {
          "field": "Net Sales",
          "val1": "366.50",
          "val2": "383.92",
          "chgp": "-4.54%",
          "chgp_class": "negative"
        },
        {
          "field": "Operating Profit (PBDIT) excl Other Income",
          "val1": "-61.65",
          "val2": "6.49",
          "chgp": "-1,049.92%",
          "chgp_class": "negative"
        },
        {
          "field": "Interest",
          "val1": "31.92",
          "val2": "25.65",
          "chgp": "24.44%",
          "chgp_class": "negative"
        },
        {
          "field": "Exceptional Items",
          "val1": "-155.03",
          "val2": "16.92",
          "chgp": "-1,016.25%",
          "chgp_class": "negative"
        },
        {
          "field": "Consolidate Net Profit",
          "val1": "-240.24",
          "val2": "-4.36",
          "chgp": "-5,410.09%",
          "chgp_class": "negative"
        },
        {
          "field": "Operating Profit Margin (Excl OI)",
          "val1": "-16.82%",
          "val2": "1.69%",
          "chgp": "-18.51%",
          "chgp_class": "negative"
        }
      ]
    }
  }
]
Quarterly Results Snapshot (Consolidated) - Sep'26 - QoQstock-summary
Sep'26
Jun'26
Change(%)
Net Sales
82.31
70.09
17.43%
Operating Profit (PBDIT) excl Other Income
6.22
2.61
138.31%
Interest
6.57
7.80
-15.77%
Exceptional Items
10.90
43.26
-74.80%
Consolidate Net Profit
16.64
40.85
-59.27%
Operating Profit Margin (Excl OI)
7.56%
3.72%
3.84%
Values in Rs Cr.
Direction Arrows
Net Sales

QoQ Growth in quarter ended Sep 2026 is 17.43% vs -18.82% in Jun 2026

Direction Arrows
Consolidated Net Profit

QoQ Growth in quarter ended Sep 2026 is -59.27% vs 120.02% in Jun 2026

Half Yearly Results Snapshot (Consolidated) - Sep'25stock-summary
Sep'25
Sep'24
Change(%)
Net Sales
180.07
195.22
-7.76%
Operating Profit (PBDIT) excl Other Income
3.32
10.88
-69.49%
Interest
13.24
10.17
30.19%
Exceptional Items
0.53
15.08
-96.49%
Consolidate Net Profit
-7.52
16.16
-146.53%
Operating Profit Margin (Excl OI)
1.84%
5.57%
-3.73%
Values in Rs Cr.
Direction Arrows
Net Sales

Growth in half year ended Sep 2025 is -7.76% vs -0.73% in Sep 2024

Direction Arrows
Consolidated Net Profit

Growth in half year ended Sep 2025 is -146.53% vs 5.76% in Sep 2024

Nine Monthly Results Snapshot (Consolidated) - Dec'25stock-summary
Dec'25
Dec'24
Change(%)
Net Sales
280.16
286.70
-2.28%
Operating Profit (PBDIT) excl Other Income
-20.22
21.07
-195.97%
Interest
24.97
17.59
41.96%
Exceptional Items
0.31
15.17
-97.96%
Consolidate Net Profit
-36.19
12.66
-385.86%
Operating Profit Margin (Excl OI)
-7.22%
7.35%
-14.57%
Values in Rs Cr.
Direction Arrows
Net Sales

YoY Growth in nine months ended Dec 2025 is -2.28% vs -1.60% in Dec 2024

Direction Arrows
Consolidated Net Profit

YoY Growth in nine months ended Dec 2025 is -385.86% vs -5.24% in Dec 2024

Annual Results Snapshot (Consolidated) - Mar'26stock-summary
Mar'26
Mar'25
Change(%)
Net Sales
366.50
383.92
-4.54%
Operating Profit (PBDIT) excl Other Income
-61.65
6.49
-1,049.92%
Interest
31.92
25.65
24.44%
Exceptional Items
-155.03
16.92
-1,016.25%
Consolidate Net Profit
-240.24
-4.36
-5,410.09%
Operating Profit Margin (Excl OI)
-16.82%
1.69%
-18.51%
Values in Rs Cr.
Direction Arrows
Net Sales

YoY Growth in year ended Mar 2026 is -4.54% vs -0.65% in Mar 2025

Direction Arrows
Consolidated Net Profit

YoY Growth in year ended Mar 2026 is -5,410.09% vs -137.39% in Mar 2025

stock-summaryCompany CV
About Elgi Rubber Company Ltd stock-summary
stock-summary
Elgi Rubber Company Ltd
Micro Cap
Industrial Products
Elgi Rubber Company Limited (ERCL) was incorporated on 16 October, 2006 in Coimbatore. From being the pioneers of Pre-cured Retreading technology and establishing the largest franchise network in India, the Company has evolved into a leading solutions provider for the Rubber Industry. It is engaged in the business of manufacturing reclaimed rubber, retreading machinery, and retreading rubber.
Company Coordinates stock-summary
Company Details
2000 Trichy Road, Singanallur Coimbatore Tamil Nadu : 641005
stock-summary
Tel: 91-0422-2321000
stock-summary
info@in.elgirubber.com
Registrar Details
Link Intime India Pvt Ltd, C-13 Pannalal Silk Compound, L B S Marg, Bhandup , Mumbai