
 Mojo Parameters
Stock DNA

Non Banking Financial Company (NBFC)

INR 11 Cr (Micro Cap)

5.00
20

0.00%

0.41

4.50%

0.23
Total ReturnsTotal Returns (Price + Dividend) 
Econo Trade Indi for the last several years.
Risk Adjusted Returns v/s
Returns Beta
 News & Corporate Actions
News
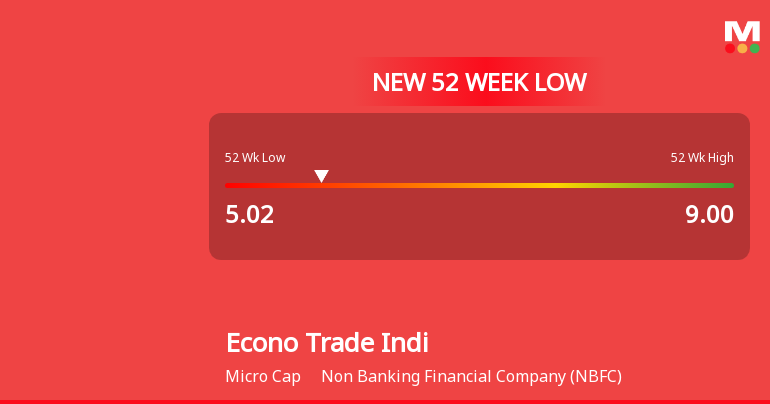
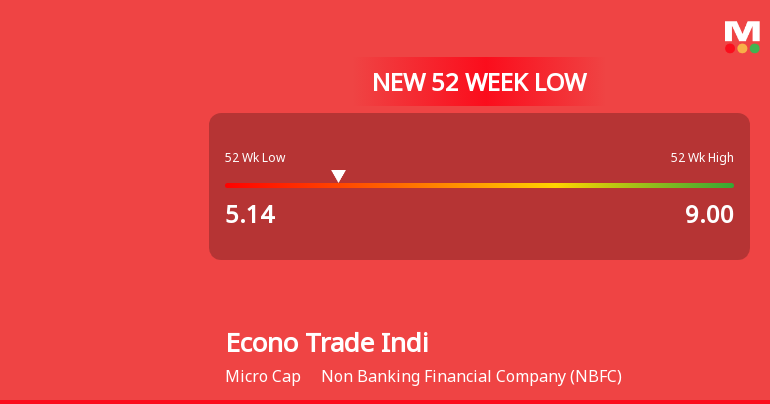
Econo Trade India Ltd Falls to 52-Week Low of Rs 5.14 as Sell-Off Deepens
A sharp decline has pushed Econo Trade India Ltd to a fresh 52-week low of Rs 5.14 on 16 Oct 2026, marking a significant 43% drop from its peak of Rs 9 within the last year. This downturn comes despite the broader market showing signs of resilience, with the Sensex gaining 0.36% and trading well above its own 52-week low.
Read More
Econo Trade India Ltd Downgraded to Strong Sell Amid Weak Fundamentals and Bearish Technicals
Econo Trade India Ltd, a micro-cap player in the Non Banking Financial Company (NBFC) sector, has seen its investment rating downgraded from Sell to Strong Sell as of 29 September 2026. This shift reflects deteriorating technical indicators, flat financial performance, and weak long-term fundamentals, despite an attractive valuation. The company’s Mojo Score has declined to 26.0, signalling heightened caution for investors amid ongoing underperformance relative to benchmarks.
Read More Announcements
Announcement under Regulation 30 (LODR)-Newspaper Publication
16-Nov-2026 | Source : BSEPlease find enclosed herewith the scanned copies of the newspaper advertisement published in "Financial Express" (Gujarati Language) on 16th November 2026 of unaudited financial results quarter ended September 2026
Announcement under Regulation 30 (LODR)-Newspaper Publication
15-Nov-2026 | Source : BSEPlease find enclosed herewith the scanned copies of the newspaper advertisement published in "Financial Express" (English Language) on 15th November 2026 of unaudited financial results quarter ended September 2026
UN-AUDITED STANDALONE FINANCIAL STATEMENTS FOR THE SECOND QUARTER AND HALF YEAR ENDED SEPTEMBER 30 2026
14-Nov-2026 | Source : BSEPlease find the attachment
Corporate Actions

No Upcoming Board Meetings

No Dividend history available

No Splits history available

No Bonus history available

No Rights history available
Key FactorsQuality key factors
Valuation key factors
Technicals key factors
 Technical Indicator Scale: Bearish, Mildly Bearish, Sideways, Mildly Bullish, Bullish Turned Shareholding
Shareholding Snapshot : Sep 2026
Shareholding Compare (%holding)
Non Institution
None
Held by 0 Schemes
Held by 0 FIIs
Robert Resources Limited (11.01%)
Arpan Das (3.4%)
52.12%
FinancialQuarterly Results Snapshot (Standalone) - Sep'26 - QoQ
 Compare with Peers

QoQ Growth in quarter ended Sep 2026 is -3.33% vs -9.64% in Jun 2026

QoQ Growth in quarter ended Sep 2026 is 1.69% vs 78.79% in Jun 2026

Half Yearly Results Snapshot (Standalone) - Sep'25
Growth in half year ended Sep 2025 is 3.00% vs -8.25% in Sep 2024
Growth in half year ended Sep 2025 is 15.24% vs 8.25% in Sep 2024
Nine Monthly Results Snapshot (Standalone) - Dec'25
YoY Growth in nine months ended Dec 2025 is 5.97% vs -12.23% in Dec 2024
YoY Growth in nine months ended Dec 2025 is 19.35% vs 2.65% in Dec 2024
Annual Results Snapshot (Standalone) - Mar'26
YoY Growth in year ended Mar 2026 is -7.79% vs -9.96% in Mar 2025
YoY Growth in year ended Mar 2026 is -3.54% vs -10.67% in Mar 2025
 Company CV
About Econo Trade India Ltd

Company Coordinates


