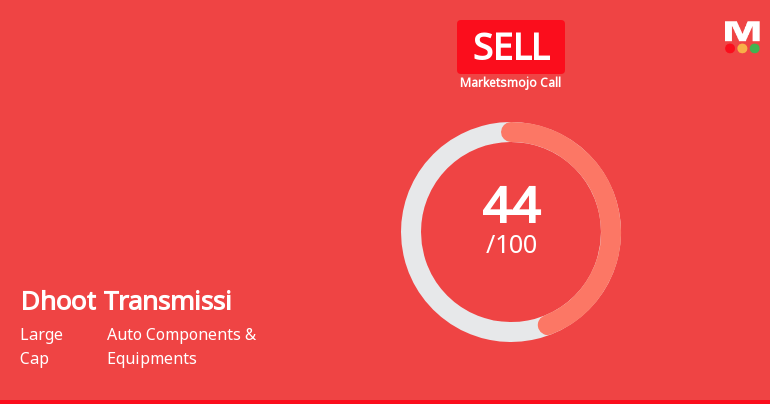
Dhoot Transmissi

  • Market Cap: Large Cap
  • Industry: Auto Components & Equipments
  • ISIN: INE01NH01023
  • NSEID: DHOOTTRANS
  • BSEID: 544867
INR
1,596.35
-21.1 (-1.3%)
BSENSE

Nov 20

BSE+NSE Vol: 22214

  • Price Points
  • Score
  • Mojo Parameters
  • Total Return
  • News and Corporate Actions
  • Key factors
  • Shareholding
  • Financials
  • CompanyCV
stock-summaryPrice Point
High/Low

1Day

52 Week

Valuation
Technical
Day's Volume

CASH

22.21 k (-66.62%) Volume

Shareholding (Sep 2026)

FII

2.17%

Held by 28 FIIs

DII

12.94%

Held by 21 DIIs

Promoter

82.78%

iScoreScore
Click here to find our call on this stock
Strong Sell
Sell
Hold
Buy
Strong Buy
Dashboard
1

Poor long term growth as Net Sales has grown by an annual rate of 23.80% and Operating profit at -149.19% over the last 5 years

 
2

Flat results in Sep 26

3

Risky - Negative Operating Profits

stock-summaryMojo Parameters
Mojo Parameters
Loading Valuation Snapshot...
Stock DNA
stock-summary
Industry

Auto Components & Equipments

stock-summary
Market cap

INR 32,704 Cr (Large Cap)

stock-summary
P/E

63.00

stock-summary
Industry P/E

38

stock-summary
Dividend Yield

0.00%

stock-summary
Debt Equity

-0.19

stock-summary
Return on Equity

6.47%

stock-summary
Price to Book

11.76

Revenue and Profits:
Net Sales:
1,827 Cr
(Quarterly Results - Sep 2026)
Net Profit:
118 Cr
stock-summaryTotal Returns
Total Returns (Price + Dividend) stock-summary
Dividend Yield (0%)
TimePeriod
Price Return
Dividend Return
Total Return
3 Months
8.81%
0%
8.81%
6 Months
0%
0%
0.0%
1 Year
0%
0%
0.0%
2 Years
0%
0%
0.0%
3 Years
0%
0%
0.0%
4 Years
0%
0%
0.0%
5 Years
0%
0%
0.0%

Dhoot Transmissi for the last several years.

Risk Adjusted Returns v/s stock-summary
Returns Beta
Icon
Beta has not been calculated since enough price history is not available
stock-summaryNews & Corporate Actions
News

Dhoot Transmission Ltd Falls 2.53%: 3 Key Factors Driving the Weekly Decline

Key Events This Week

16 Nov: Rating upgraded to Hold on technical and financial improvements

18 Nov: Downgrade to Sell amid deteriorating fundamentals

19 Nov: Intraday high surge of 3.14% to Rs.1,606

20 Nov: Week closes lower at Rs.1,596.35 (-2.53%)

Dhoot Transmission Gains 2.32%: 3 Key Factors Driving the Week's Momentum

Announcements stock-summary

Announcement under Regulation 30 (LODR)-Earnings Call Transcript

10-Nov-2026 | Source : BSE

Please find enclosed.

Announcement under Regulation 30 (LODR)-Investor Presentation

04-Nov-2026 | Source : BSE

Revised Investor Presentation incorporating a typographical correction.

Announcement under Regulation 30 (LODR)-Newspaper Publication

04-Nov-2026 | Source : BSE

Newspaper Advertisement- Publication of Unaudited (Standalone and Consolidated) Financial Results for the quarter and half year ended September 30 2026.

Corporate Actions stock-summary
stock-summary
BOARD MEETING

No Upcoming Board Meetings

stock-summary
DIVIDEND

No Dividend history available

stock-summary
SPLITS

No Splits history available

stock-summary
BONUS

No Bonus history available

stock-summary
RIGHTS

No Rights history available

stock-summaryKey Factors
Quality key factors stock-summary
Factor
Value
Sales Growth (5y)
23.80%
EBIT Growth (5y)
-149.19%
EBIT to Interest (avg)
4.00
Debt to EBITDA (avg)
1.10
Net Debt to Equity (avg)
-0.19
Sales to Capital Employed (avg)
1.82
Tax Ratio
0
Dividend Payout Ratio
0
Pledged Shares
0
Institutional Holding
15.11%
ROCE (avg)
30.59%
ROE (avg)
21.70%
Valuation key factors
Factor
Value
P/E Ratio
63
Industry P/E
38
Price to Book Value
11.60
EV to EBIT
-469.55
EV to EBITDA
EV to Capital Employed
14.04
EV to Sales
9.21
PEG Ratio
NA
Dividend Yield
NA
ROCE (Latest)
-2.99%
ROE (Latest)
6.47%
Technicals key factors
Indicator
Weekly
Monthly
MACD
RSI
Bollinger Bands
KST
Dow Theory
No Trend
OBV
No Trend
stock-summary Technical Indicator Scale: Bearish, Mildly Bearish, Sideways, Mildly Bullish, Bullish  Turned 
stock-summaryShareholding
Shareholding Snapshot : Sep 2026stock-summary
Shareholding Compare (%holding) stock-summary
Majority shareholders

Promoters

Pledged Promoter Holdings

None

Mutual Funds

Held by 24 Schemes (11.58%)

FIIs

Held by 28 FIIs (2.17%)

Promoter with highest holding

Bc Asia Investments Xv Limited (42.84%)

Highest Public shareholder

Hsbc Mutual Fund - Hsbc Aggressive Hybrid Fund (3.68%)

Individual Investors Holdings

1.76%

stock-summaryFinancial
[
  {
    "link": "quarterly",
    "btn_text": "All Quarterly Results",
    "header": "Quarterly Results Snapshot (Standalone) - Sep'26 - QoQ",
    "rhs": [
      {
        "prefix": "Net Sales ",
        "suffix": "QoQ Growth in quarter ended Sep 2026 is 17.28% vs 9.05% in Jun 2026",
        "dir": 1
      },
      {
        "prefix": "Standalone Net Profit ",
        "suffix": "QoQ Growth in quarter ended Sep 2026 is -76.22% vs 26.00% in Jun 2026",
        "dir": -1
      }
    ],
    "table": {
      "header": [
        "Sep'26",
        "Jun'26",
        "Change(%)"
      ],
      "body": [
        {
          "field": "Net Sales",
          "val1": "1,263.57",
          "val2": "1,077.43",
          "chgp": "17.28%",
          "chgp_class": "positive"
        },
        {
          "field": "Operating Profit (PBDIT) excl Other Income",
          "val1": "84.31",
          "val2": "103.85",
          "chgp": "-18.82%",
          "chgp_class": "negative"
        },
        {
          "field": "Interest",
          "val1": "9.30",
          "val2": "8.88",
          "chgp": "4.73%",
          "chgp_class": "negative"
        },
        {
          "field": "Exceptional Items",
          "val1": "-39.75",
          "val2": "-2.00",
          "chgp": "-1,887.50%",
          "chgp_class": "negative"
        },
        {
          "field": "Standalone Net Profit",
          "val1": "13.61",
          "val2": "57.24",
          "chgp": "-76.22%",
          "chgp_class": "negative"
        },
        {
          "field": "Operating Profit Margin (Excl OI)",
          "val1": "6.67%",
          "val2": "9.64%",
          "chgp": "-2.97%",
          "chgp_class": "negative"
        }
      ]
    }
  },
  {
    "link": "half-yearly",
    "btn_text": "All Half Yearly Results",
    "alert": "No Half Yearly Results declared by Dhoot Transmissi"
  },
  {
    "link": "nine-monthly",
    "btn_text": "All Nine Monthly Results",
    "alert": "No Nine Monthly Results declared by Dhoot Transmissi"
  },
  {
    "link": "annual",
    "btn_text": "All Annual Results",
    "header": "Annual Results Snapshot (Standalone) - Mar'26",
    "rhs": [
      {
        "prefix": "Net Sales ",
        "suffix": "YoY Growth in year ended Mar 2026 is 34.46% vs 14.08% in Mar 2025",
        "dir": 1
      },
      {
        "prefix": "Standalone Net Profit ",
        "suffix": "YoY Growth in year ended Mar 2026 is 9.34% vs -17.61% in Mar 2025",
        "dir": 1
      }
    ],
    "table": {
      "header": [
        "Mar'26",
        "Mar'25",
        "Change(%)"
      ],
      "body": [
        {
          "field": "Net Sales",
          "val1": "3,486.07",
          "val2": "2,592.74",
          "chgp": "34.46%",
          "chgp_class": "positive"
        },
        {
          "field": "Operating Profit (PBDIT) excl Other Income",
          "val1": "0.00",
          "val2": "302.63",
          "chgp": "-100.00%",
          "chgp_class": "negative"
        },
        {
          "field": "Interest",
          "val1": "63.95",
          "val2": "44.23",
          "chgp": "44.59%",
          "chgp_class": "negative"
        },
        {
          "field": "Exceptional Items",
          "val1": "-11.12",
          "val2": "0.00",
          "chgp": "",
          "chgp_class": "neutral"
        },
        {
          "field": "Standalone Net Profit",
          "val1": "170.98",
          "val2": "156.38",
          "chgp": "9.34%",
          "chgp_class": "positive"
        },
        {
          "field": "Operating Profit Margin (Excl OI)",
          "val1": "0.00%",
          "val2": "11.67%",
          "chgp": "-11.67%",
          "chgp_class": "negative"
        }
      ]
    }
  }
]
Quarterly Results Snapshot (Standalone) - Sep'26 - QoQstock-summary
Sep'26
Jun'26
Change(%)
Net Sales
1,263.57
1,077.43
17.28%
Operating Profit (PBDIT) excl Other Income
84.31
103.85
-18.82%
Interest
9.30
8.88
4.73%
Exceptional Items
-39.75
-2.00
-1,887.50%
Standalone Net Profit
13.61
57.24
-76.22%
Operating Profit Margin (Excl OI)
6.67%
9.64%
-2.97%
Values in Rs Cr.
Direction Arrows
Net Sales

QoQ Growth in quarter ended Sep 2026 is 17.28% vs 9.05% in Jun 2026

Direction Arrows
Standalone Net Profit

QoQ Growth in quarter ended Sep 2026 is -76.22% vs 26.00% in Jun 2026

Annual Results Snapshot (Standalone) - Mar'26stock-summary
Mar'26
Mar'25
Change(%)
Net Sales
3,486.07
2,592.74
34.46%
Operating Profit (PBDIT) excl Other Income
0.00
302.63
-100.00%
Interest
63.95
44.23
44.59%
Exceptional Items
-11.12
0.00
Standalone Net Profit
170.98
156.38
9.34%
Operating Profit Margin (Excl OI)
0.00%
11.67%
-11.67%
Values in Rs Cr.
Direction Arrows
Net Sales

YoY Growth in year ended Mar 2026 is 34.46% vs 14.08% in Mar 2025

Direction Arrows
Standalone Net Profit

YoY Growth in year ended Mar 2026 is 9.34% vs -17.61% in Mar 2025

stock-summaryCompany CV
About stock-summary
stock-summary
Company Coordinates stock-summary
Company Details
stock-summary
Tel:
stock-summary
stock-summary
Registrar Details