
 Score
Dashboard
With a Negative Book Value, the company has a Weak Long Term Fundamental Strength
- Poor long term growth as Net Sales has grown by an annual rate of 0.00% and Operating profit at 0% over the last 5 years
- High Debt Company with a Debt to Equity ratio (avg) at 0 times
Flat results in Sep 26
Stock is technically in a Bearish range
Risky - Negative EBITDA
Underperformed the market in the last 1 year
Mojo ParametersStock DNA

Tyres & Rubber Products

INR 22 Cr (Micro Cap)

NA (Loss Making)
88

0.00%

-1.75

19.49%

-9.46
Total ReturnsTotal Returns (Price + Dividend) 
Cochin Malabar for the last several years.
Risk Adjusted Returns v/s
Returns Beta
 News & Corporate Actions
News
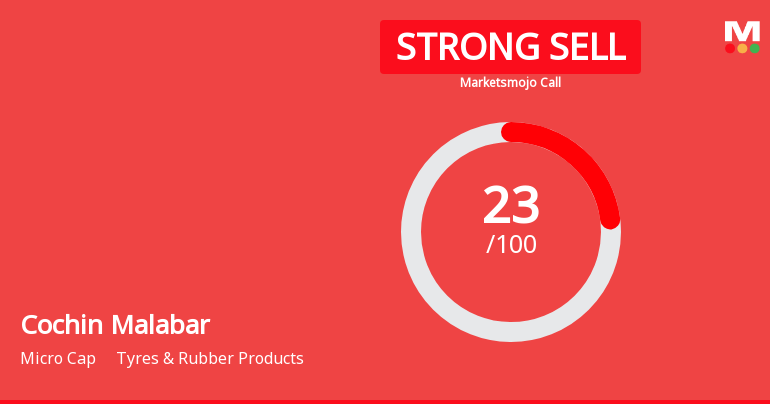
Cochin Malabar Estates & Industries Ltd Downgraded to Strong Sell Amid Technical and Fundamental Weakness
Cochin Malabar Estates & Industries Ltd, a micro-cap player in the Tyres & Rubber Products sector, has seen its investment rating downgraded from Sell to Strong Sell as of 16 Oct 2026. The downgrade reflects deteriorating technical indicators, weak financial trends, poor valuation metrics, and declining quality scores, signalling heightened risk for investors amid a challenging market environment.
Read More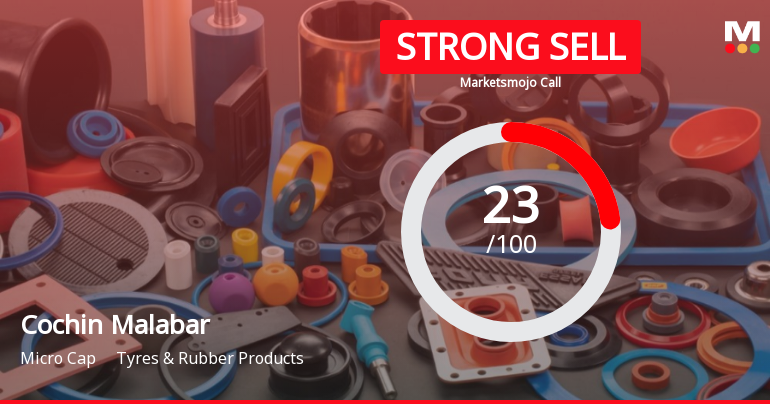
Cochin Malabar Estates & Industries Ltd Downgraded to Strong Sell Amid Weak Fundamentals and Mixed Technicals
Cochin Malabar Estates & Industries Ltd, a micro-cap player in the Tyres & Rubber Products sector, has seen its investment rating downgraded from Sell to Strong Sell as of 22 Sep 2026. This revision reflects a combination of deteriorating financial fundamentals, subdued valuation metrics, and a nuanced shift in technical indicators, signalling heightened risk for investors amid flat quarterly performance and negative long-term trends.
Read More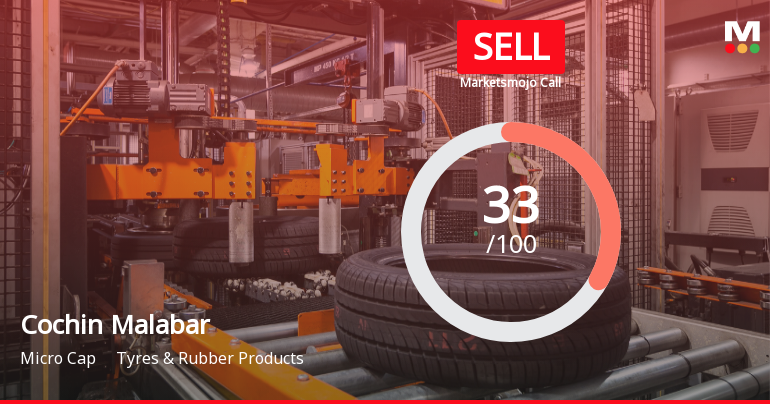
Cochin Malabar Estates & Industries Ltd Upgraded to Sell on Technical Improvements
Cochin Malabar Estates & Industries Ltd has seen its investment rating upgraded from Strong Sell to Sell as of 17 Sep 2026, driven primarily by a shift in technical indicators. However, the company’s fundamental and financial metrics remain under pressure, reflecting ongoing challenges in profitability and valuation within the Tyres & Rubber Products sector.
Read More Announcements
Announcement under Regulation 30 (LODR)-Newspaper Publication
18-Nov-2026 | Source : BSESpecial Window for transfer and dematerialisation (demat) of physical shares.
Announcement under Regulation 30 (LODR)-Newspaper Publication
31-Oct-2026 | Source : BSESubmission of Newspaper Advertisement of Unaudited Financial Results of the Company for the quarter and half-year ended 30th September 2026.
Board Meeting Outcome for Unaudited Financial Results For The Quarter/Half Year Ended 30Th September 2026.
30-Oct-2026 | Source : BSEPursuant to Regulation 33 of the SEBI (Listing Obligations and Disclosure Requirements) Regulations 2015 we enclose a copy of the Unaudited Financial Results of the Company for the Quarter / Half Year ended 30th September 2026 approved at the meeting of the Board of Directors of the Company held on 30th October 2026.
Corporate Actions

No Upcoming Board Meetings

No Dividend history available

No Splits history available

No Bonus history available

No Rights history available
Key FactorsQuality key factors
Valuation key factors
Technicals key factors
 Technical Indicator Scale: Bearish, Mildly Bearish, Sideways, Mildly Bullish, Bullish Turned Shareholding
Shareholding Snapshot : Sep 2026
Shareholding Compare (%holding)
Promoters
None
Held by 0 Schemes
Held by 0 FIIs
Shri Vasuprada Plantations Limited (24.68%)
Life Insurance Corporation Of India (16.76%)
18.92%
FinancialQuarterly Results Snapshot (Standalone) - Sep'26 - YoY
 Compare with Peers
YoY Growth in quarter ended Sep 2026 is 0.00% vs 0.00% in Sep 2025

YoY Growth in quarter ended Sep 2026 is -44.44% vs 40.00% in Sep 2025

Half Yearly Results Snapshot (Standalone) - Sep'25
Growth in half year ended Sep 2025 is 0.00% vs 0.00% in Sep 2024

Growth in half year ended Sep 2025 is 35.48% vs 11.43% in Sep 2024
Nine Monthly Results Snapshot (Standalone) - Dec'25
YoY Growth in nine months ended Dec 2025 is 0.00% vs 0.00% in Dec 2024
YoY Growth in nine months ended Dec 2025 is 33.33% vs 10.00% in Dec 2024
Annual Results Snapshot (Standalone) - Mar'26
YoY Growth in year ended Mar 2026 is 0.00% vs 0.00% in Mar 2025
YoY Growth in year ended Mar 2026 is -135.94% vs 156.00% in Mar 2025
 Company CV
About Cochin Malabar Estates & Industries Ltd

Company Coordinates


