Beardsell

  • Market Cap: Micro Cap
  • Industry: Other Industrial Products
  • ISIN: INE520H01022
  • NSEID: BEARDSELL
  • BSEID: 539447
INR
37.82
0.00 (0.00%)
BSENSE

Nov 20

BSE+NSE Vol: 64.91 k

  • Price Points
  • Score
  • Mojo Parameters
  • Total Return
  • News and Corporate Actions
  • Key factors
  • Shareholding
  • Financials
  • CompanyCV
stock-summaryPrice Point
High/Low

1Day

52 Week

Valuation
Technical
Day's Volume

CASH

64.91 k (16.20%) Volume

Shareholding (Sep 2026)

FII

0.00%

Held by 0 FIIs

DII

0.31%

Held by 0 DIIs

Promoter

52.68%

Who are the top shareholders of the Beardsell?

06-Jun-2025

The top shareholders of Beardsell include Mrs. Anumolu Jayasree with 35.27%, individual investors with 39.47%, and Mahendra Girdharilal as the highest public shareholder at 3.15%. There are no pledged promoter holdings, and institutional involvement is minimal.

The top shareholders of Beardsell include the promoters, with Mrs. Anumolu Jayasree holding the largest share at 35.27%. Additionally, individual investors collectively hold 39.47% of the shares. The highest public shareholder is Mahendra Girdharilal, who owns 3.15%. There are no pledged promoter holdings, and the company has limited institutional involvement, with only one Foreign Institutional Investor (FII) holding a negligible percentage.

Read More

how big is Beardsell?

06-Jun-2025

As of Jun 06, Beardsell Ltd has a market capitalization of 120.36 Cr and reported net sales of 268.35 Cr and net profit of 9.83 Cr over the latest four quarters.

Market Cap: Beardsell Ltd has a market capitalization of 120.36 Cr and is classified as a Micro Cap company as of Jun 06.<BR><BR>Recent Quarterly Performance: The sum of Net Sales for the latest 4 quarters, which includes data from Mar'25, Dec'24, Sep'24, and Jun'24, is 268.35 Cr. The sum of Net Profit for the same period is 9.83 Cr. This data is consolidated.<BR><BR>Balance Sheet Snapshot: This is consolidated data for the latest annual period ending Mar'24. Shareholder's Funds are reported at 70.96 Cr, and Total Assets amount to 160.39 Cr.

Read More

Who are in the management team of Beardsell?

06-Jun-2025

As of March 2022, Beardsell's management team includes Amrith Anumolu (Director), A Jayasree (Director), Gurram Jagannatha Reddy (Independent Director), Rammohan Anappathur Vanchi (Independent Director), R Gowri Shankar (Chairman), Kanhu Charan Sahu (Company Secretary), V J Singh (Director), and Mannam Malakondaiah (Independent Director), with varying remuneration levels.

As of March 2022, the management team of Beardsell includes the following individuals:<BR><BR>1. Amrith Anumolu - Director, with a remuneration of Rs. 37.96 lacs.<BR>2. A Jayasree - Director, with a remuneration of Rs. 2.4 lacs.<BR>3. Gurram Jagannatha Reddy - Independent Director, with a remuneration of Rs. 4.55 lacs.<BR>4. Rammohan Anappathur Vanchi - Independent Director, with a remuneration of Rs. 4.45 lacs.<BR>5. R Gowri Shankar - Chairman (Non-Executive), with a remuneration of Rs. 3.05 lacs.<BR>6. Kanhu Charan Sahu - Company Secretary & Compliance Officer, with no remuneration listed.<BR>7. V J Singh - Director, with a remuneration of Rs. 3.45 lacs.<BR>8. Mannam Malakondaiah - Independent Director, with no remuneration listed.<BR><BR>This team comprises a mix of directors, independent directors, and a compliance officer, contributing to the governance and oversight of the company.

Read More

When is the next results date for Beardsell?

06-Jun-2025

No Upcoming Board Meetings

What is the bonus history of the Beardsell?

06-Jun-2025

Beardsell Ltd announced a 1:5 bonus issue on May 4, 2017, with a record date of May 5, 2017, meaning shareholders received one additional share for every five shares held.

Beardsell Ltd has a bonus history that includes a 1:5 bonus issue announced on May 4, 2017. The record date for this bonus was May 5, 2017. This means that for every five shares held, shareholders received one additional share. If you have any more questions about Beardsell or need further details, feel free to ask!

Read More

Has Beardsell declared dividend?

06-Jun-2025

Yes, Beardsell Ltd has declared a 5% dividend, amounting to $0.10 per share, with an ex-date of September 23, 2024. Recent total returns show significant short-term losses, but strong gains over longer periods.

Beardsell Ltd has declared a 5% dividend.<BR><BR>Dividend Details:<BR>- Percentage announced: 5%<BR>- Amount per share: $0.10<BR>- Ex-date: 23 Sep 2024<BR><BR>Dividend Yield: 0.31%.<BR><BR>Total Returns by Period:<BR>In the last 6 months, the price return was -25.44%, with a dividend return of 0%, resulting in a total return of -25.44%.<BR><BR>Over the past year, the price return was -17.52%, the dividend return was 0.26%, leading to a total return of -17.26%.<BR><BR>In the 2-year period, the price return was -15.83%, with a dividend return of 0.68%, resulting in a total return of -15.15%.<BR><BR>For the 3-year period, the price return was 111.58%, the dividend return was 2.00%, culminating in a total return of 113.58%.<BR><BR>In the last 4 years, the price return was 123.84%, with a dividend return of 2.94%, leading to a total return of 126.78%.<BR><BR>Over the 5-year period, the price return was 245.14%, the dividend return was 5.81%, resulting in a total return of 250.95%.<BR><BR>Overall, Beardsell Ltd has declared a dividend, but the recent total returns indicate a mixed performance, with significant losses in the short term contrasted by substantial gains over longer periods.

Read More

Who are the peers of the Beardsell?

03-Jun-2025

Beardsell's peers include PTC Industries, Inox India, Esab India, KRN Heat Exchan, Kirloskar Industries, Delta Manufacturing, Welcast Steels, Indobell Insulation, and Sprayking Ltd. In terms of management risk, growth, and capital structure, Beardsell ranks average, with a 1-year return of -1.56%, better than Sprayking Ltd but worse than PTC Industries at 55.24%.

Peers: The peers of Beardsell are PTC Industries, Inox India, Esab India, KRN Heat Exchan, Kirloskar Indus., Delta Manufact., Welcast Steels, Indobell Insul., Sprayking Ltd.<BR><BR>Quality Snapshot: Excellent management risk is observed at Inox India and Esab India, while Good management risk is found at KRN Heat Exchan. Average management risk is present at PTC Industries, Kirloskar Indus., Welcast Steels, and Beardsell, while Below Average management risk is noted at Delta Manufact., Indobell Insul., and Sprayking Ltd. Growth is Excellent at Kirloskar Indus., Good at KRN Heat Exchan, Below Average at Inox India, Esab India, and Welcast Steels, and Below Average at Beardsell, while Average growth is found at PTC Industries and Indobell Insul., and Excellent growth is noted at Sprayking Ltd. Capital Structure is Excellent at Inox India, Esab India, and KRN Heat Exchan, Good at Kirloskar Indus. and Welcast Steels, Average at PTC Industries and Beardsell, and Below Average at Delta Manufact., Indobell Insul., and Sprayking Ltd.<BR><BR>Return Snapshot: PTC Industries has the highest 1-year return at 55.24%, while Sprayking Ltd has the lowest at -65.49%. Beardsell's 1-year return of -1.56% is better than Sprayking Ltd's but worse than PTC Industries. Additionally, KRN Heat Exchan, Esab India, Kirloskar Indus., Delta Manufact., Welcast Steels, Indobell Insul., and Sprayking Ltd all have negative six-month returns.

Read More

What is the technical trend for Beardsell?

09-Jun-2025

As of July 22, 2024, Beardsell's technical trend shifted from mildly bearish to indeterminate due to insufficient data.

As of 22 July 2024, the technical trend for Beardsell changed from mildly bearish to does not qualify. The lack of sufficient technical summary data prevents a definitive stance on the current market position.

Read More

What does Beardsell do?

17-Jul-2025

Beardsell Ltd is a Micro Cap company established in 1936, specializing in the manufacture of industrial products. As of March 2025, it reported net sales of 754 Cr and a net profit of 19 Cr, with a market cap of INR 120 Cr.

Overview:<BR>Beardsell Ltd is a diversified group engaged in the manufacture of various industrial products, operating within the Other Industrial Products industry and classified as a Micro Cap company.<BR><BR>History:<BR>Incorporated in 1936, Beardsell Ltd has maintained its status as a manufacturer of industrial products. The latest quarterly results reported net sales and net profit for the period ending March 2025.<BR><BR>Financial Snapshot:<BR>Most recent Net Sales: 754 Cr (Quarterly Results - Mar 2025) <BR>Most recent Net Profit: 19 Cr (Quarterly Results - Mar 2025) <BR>Market-cap value: INR 120 Cr (Micro Cap)<BR><BR>Key Metrics:<BR>P/E: 12.00 <BR>Industry P/E: 47 <BR>Dividend Yield: 0.32% <BR>Debt Equity: 0.24 <BR>Return on Equity: 12.11% <BR>Price to Book: 1.46 <BR><BR>Contact Details:<BR>Address: 47 Greams Road, Chennai Tamil Nadu: 600006 <BR>Phone: 91-44-28293296/28290901 <BR>Email: ho@beardsell.co.in <BR>Website: http://www.beardsell.co.in

Read More

Are Beardsell latest results good or bad?

12-Aug-2025

Beardsell's latest results are mixed but lean negative, with record net sales of Rs 67.87 crore overshadowed by a 53.92% drop in profit after tax and rising financial strain. Investors should be cautious due to declining profitability and increased reliance on non-operating income.

Beardsell's latest financial results for the quarter ending March 2024 indicate a mixed performance, leaning towards negative overall. While the company achieved its highest net sales in the last five quarters at Rs 67.87 crore, this positive aspect is overshadowed by significant declines in profitability and increased financial strain.<BR><BR>The profit after tax has dropped sharply by 53.92% year on year, and the operating profit margin is at its lowest in the last five quarters. Additionally, the company's ability to manage interest payments has worsened, with a declining operating profit to interest ratio. The interest costs have also risen by 25.49% quarter on quarter, reflecting increased borrowings.<BR><BR>Moreover, the earnings per share are at their lowest in five quarters, indicating reduced profitability for shareholders. The reliance on non-operating income, which constitutes a significant portion of profit before tax, raises concerns about the sustainability of the business model.<BR><BR>Overall, while there are some positive sales trends, the substantial declines in profit and increasing financial challenges suggest that Beardsell's latest results are not favorable. Investors should approach this situation with caution and consider the various factors at play before making any decisions.

Read More

How has been the historical performance of Beardsell?

14-Nov-2025

Beardsell has shown consistent growth in net sales and profits, with net sales increasing from 186.14 Cr in Mar'22 to 268.35 Cr in Mar'25, and profit after tax rising from 2.81 Cr to 9.83 Cr in the same period. The company's financial metrics indicate strong operational efficiency and favorable market positioning.

Answer:<BR>The historical performance of Beardsell shows a consistent growth in net sales and profit over the years, with notable improvements in various financial metrics.<BR><BR>Breakdown:<BR>Beardsell's net sales have increased from 186.14 Cr in Mar'22 to 268.35 Cr in Mar'25, reflecting a strong upward trend. Total operating income has followed a similar trajectory, rising from 186.14 Cr in Mar'22 to 268.35 Cr in Mar'25. The company's total expenditure, excluding depreciation, also grew, reaching 245.65 Cr in Mar'25 from 173.77 Cr in Mar'22. Operating profit, excluding other income, improved from 12.37 Cr in Mar'22 to 22.70 Cr in Mar'25, while profit before tax rose from 3.91 Cr in Mar'22 to 12.68 Cr in Mar'25. Consequently, profit after tax increased significantly from 2.81 Cr in Mar'22 to 9.83 Cr in Mar'25. The earnings per share (EPS) also showed a positive trend, moving from 0.75 in Mar'22 to 2.49 in Mar'25. On the balance sheet, total assets grew from 127.07 Cr in Mar'22 to 174.64 Cr in Mar'25, while total liabilities increased from 127.07 Cr to 174.64 Cr in the same period. Cash flow from operating activities improved from 8.00 Cr in Mar'22 to 19.00 Cr in Mar'25, indicating enhanced operational efficiency. Overall, Beardsell has demonstrated solid growth in sales, profits, and cash flow, positioning itself favorably in the market.

Read More

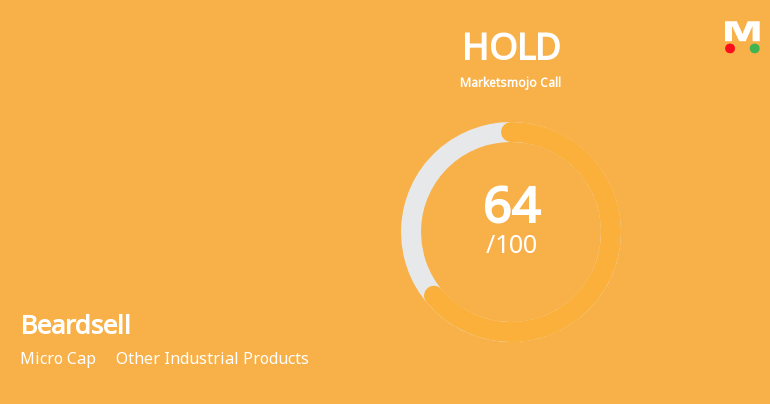
Should I buy, sell or hold Beardsell?

16-Nov-2025

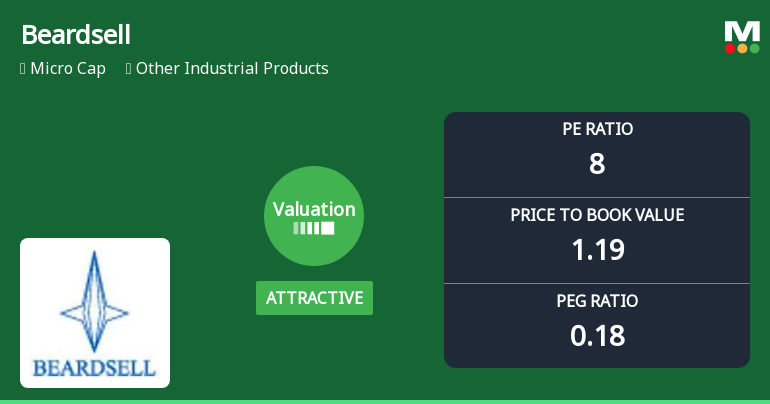
Is Beardsell overvalued or undervalued?

18-Nov-2025

As of November 17, 2025, Beardsell is considered fairly valued with a PE ratio of 13.62, an EV to EBITDA of 6.67, and a PEG ratio of 0.98, outperforming peers like Godrej Industries and Solar Industries, while achieving a 5-year return of 262.36% compared to the Sensex's 102.06%.

As of 17 November 2025, Beardsell's valuation grade has moved from very attractive to attractive, indicating a shift in market perception. The company is currently assessed as fairly valued. Key ratios include a PE ratio of 13.62, an EV to EBITDA of 6.67, and a PEG ratio of 0.98, which suggest that the company is reasonably priced relative to its earnings growth potential.<BR><BR>In comparison to its peers, Beardsell's valuation metrics stand out, particularly against companies like Godrej Industries, which has a significantly higher PE ratio of 37.63, and Solar Industries, which is deemed very expensive with a PE of 95.31. Despite a recent decline in stock price, Beardsell has shown strong long-term performance, with a 5-year return of 262.36%, outperforming the Sensex's 102.06% over the same period.

Read More

Which are the latest news on Beardsell?

03-Dec-2025

Why is Beardsell falling/rising?

03-Dec-2025

As of 03-Dec, Beardsell Ltd's stock price is rising to 30.55, reflecting a 2.48% increase and outperforming its sector today. Despite a long-term downward trend, recent trading activity suggests a temporary rebound driven by increased investor participation.

As of 03-Dec, Beardsell Ltd's stock price is rising, currently at 30.55, reflecting an increase of 0.74 or 2.48%. This upward movement is notable as the stock has outperformed its sector by 3.77% today. Additionally, the stock opened with a significant gain of 5.67% and reached an intraday high of Rs 31.75, which is a 6.51% increase.<BR><BR>Despite the recent positive performance, it's important to note that the stock has been on a downward trend over the past several weeks, having fallen every week for the last eight weeks and every month for the last six weeks, resulting in -100% returns during these periods. However, the recent rise in price could be attributed to increased investor participation, as evidenced by a 55.52% increase in delivery volume compared to the 5-day average.<BR><BR>Overall, while the stock has faced significant declines over longer periods, the recent trading activity indicates a temporary rebound, driven by positive daily performance and increased trading volume.

Read More
iScoreScore
Click here to find our call on this stock
Strong Sell
Sell
Hold
Buy
Strong Buy
Dashboard
1

Company has a low Debt to Equity ratio (avg) at 0.34 times

 
2

The company declared positive results in Sep'26 after flat results in Jun'26

3

With ROCE of 15.8, it has a Very Attractive valuation with a 1.1 Enterprise value to Capital Employed

4

Majority shareholders : Promoters

 
stock-summaryMojo Parameters
Mojo Parameters
Loading Valuation Snapshot...
Stock DNA
stock-summary
Industry

Other Industrial Products

stock-summary
Market cap

INR Cr (Micro Cap)

stock-summary
P/E

8.00

stock-summary
Industry P/E

24

stock-summary
Dividend Yield

0.00%

stock-summary
Debt Equity

0.00

stock-summary
Return on Equity

0.00%

stock-summary
Price to Book

0.00

Revenue and Profits:
Net Sales:
80 Cr
(Quarterly Results - Sep 2026)
Net Profit:
5 Cr
stock-summaryTotal Returns
Total Returns (Price + Dividend) stock-summary
Dividend Yield (%)
TimePeriod
Price Return
Dividend Return
Total Return
3 Months
0%
0.26%
0.26%
6 Months
0%
0%
0.0%
1 Year
0%
0%
0.0%
2 Years
0%
0%
0.0%
3 Years
-25.68%
0.68%
-25.0%
4 Years
69.6%
1.76%
71.36%
5 Years
175.46%
4.24%
179.7%

Latest dividend: 0.1 per share ex-dividend date: Sep-21-2026

Risk Adjusted Returns v/s stock-summary
Returns Beta
Icon
Beta has not been calculated since enough price history is not available
stock-summaryNews & Corporate Actions
News
Announcements stock-summary

Compliances-Certificate under Reg. 74 (5) of SEBI (DP) Regulations 2018

16-Jul-2024 | Source : BSE

We are submitting herewith the captioned certificate for quarter ended 30/06/2024

Voluntary Delisting Only From BSE

10-Jul-2024 | Source : BSE

Approval letter received from BSE pertaining to delisting of shares only from BSE pursuant to Chapter III Part A of SEBI (Delisting of Equity Shares) Regulations 2021

Shareholder Meeting / Postal Ballot-Scrutinizers Report

28-Jun-2024 | Source : BSE

We submitting herewith the proceedings of Postal Ballot concluded on 27/06/2024 along with the Scrutinisers Report and Voting Results for your record and dissemination.

Corporate Actions stock-summary
stock-summary
BOARD MEETING

No Upcoming Board Meetings

stock-summary
DIVIDEND

Beardsell Ltd has declared 5% dividend, ex-date: 21 Sep 26

stock-summary
SPLITS

Beardsell Ltd has announced 2:10 stock split, ex-date: 04 May 17

stock-summary
BONUS

Beardsell Ltd has announced 1:5 bonus issue, ex-date: 04 May 17

stock-summary
RIGHTS

Beardsell Ltd has announced 1:3 rights issue, ex-date: 16 Dec 21

stock-summaryKey Factors
Quality key factors stock-summary
Factor
Value
Sales Growth (5y)
11.77%
EBIT Growth (5y)
21.21%
EBIT to Interest (avg)
3.93
Debt to EBITDA (avg)
1.62
Net Debt to Equity (avg)
0.16
Sales to Capital Employed (avg)
2.37
Tax Ratio
21.09%
Dividend Payout Ratio
4.01%
Pledged Shares
0
Institutional Holding
0.31%
ROCE (avg)
13.42%
ROE (avg)
12.14%
Valuation key factors
Factor
Value
P/E Ratio
8
Industry P/E
24
Price to Book Value
1.07
EV to EBIT
6.75
EV to EBITDA
4.74
EV to Capital Employed
1.06
EV to Sales
0.42
PEG Ratio
0.17
Dividend Yield
0.35%
ROCE (Latest)
15.77%
ROE (Latest)
13.72%
Technicals key factors
Indicator
Weekly
Monthly
Icon
Technical indicator has not been calculated since the stock has been active for a short period
stock-summary Technical Indicator Scale: Bearish, Mildly Bearish, Sideways, Mildly Bullish, Bullish  Turned 
stock-summaryShareholding
Shareholding Snapshot : Sep 2026stock-summary
Shareholding Compare (%holding) stock-summary
Majority shareholders

Promoters

Pledged Promoter Holdings

None

Mutual Funds

Held by 0 Schemes

FIIs

Held by 0 FIIs

Promoter with highest holding

Mrs. Anumolu Jayasree (35.27%)

Highest Public shareholder

Mahendra Girdharilal (3.15%)

Individual Investors Holdings

38.32%

stock-summaryFinancial
[
  {
    "link": "quarterly",
    "btn_text": "All Quarterly Results",
    "header": "Quarterly Results Snapshot (Consolidated) - Sep'26 - QoQ",
    "rhs": [
      {
        "prefix": "Net Sales ",
        "suffix": "QoQ Growth in quarter ended Sep 2026 is 10.36% vs 0.59% in Jun 2026",
        "dir": 1
      },
      {
        "prefix": "Consolidated Net Profit ",
        "suffix": "QoQ Growth in quarter ended Sep 2026 is 115.93% vs -48.40% in Jun 2026",
        "dir": 1
      }
    ],
    "table": {
      "header": [
        "Sep'26",
        "Jun'26",
        "Change(%)"
      ],
      "body": [
        {
          "field": "Net Sales",
          "val1": "79.68",
          "val2": "72.20",
          "chgp": "10.36%",
          "chgp_class": "positive"
        },
        {
          "field": "Operating Profit (PBDIT) excl Other Income",
          "val1": "8.82",
          "val2": "4.26",
          "chgp": "107.04%",
          "chgp_class": "positive"
        },
        {
          "field": "Interest",
          "val1": "0.61",
          "val2": "0.59",
          "chgp": "3.39%",
          "chgp_class": "negative"
        },
        {
          "field": "Exceptional Items",
          "val1": "0.00",
          "val2": "0.00",
          "chgp": "",
          "chgp_class": "neutral"
        },
        {
          "field": "Consolidate Net Profit",
          "val1": "4.88",
          "val2": "2.26",
          "chgp": "115.93%",
          "chgp_class": "positive"
        },
        {
          "field": "Operating Profit Margin (Excl OI)",
          "val1": "11.07%",
          "val2": "5.90%",
          "chgp": "5.17%",
          "chgp_class": "positive"
        }
      ]
    }
  },
  {
    "link": "half-yearly",
    "btn_text": "All Half Yearly Results",
    "header": "Half Yearly Results Snapshot (Consolidated) - Sep'25",
    "rhs": [
      {
        "prefix": "Net Sales ",
        "suffix": " Growth in half year ended Sep 2025 is 6.66% vs 9.22% in Sep 2024",
        "dir": -1
      },
      {
        "prefix": "Consolidated Net Profit ",
        "suffix": " Growth in half year ended Sep 2025 is -9.01% vs -0.55% in Sep 2024",
        "dir": -1
      }
    ],
    "table": {
      "header": [
        "Sep'25",
        "Sep'24",
        "Change(%)"
      ],
      "body": [
        {
          "field": "Net Sales",
          "val1": "136.67",
          "val2": "128.14",
          "chgp": "6.66%",
          "chgp_class": "positive"
        },
        {
          "field": "Operating Profit (PBDIT) excl Other Income",
          "val1": "11.46",
          "val2": "12.14",
          "chgp": "-5.60%",
          "chgp_class": "negative"
        },
        {
          "field": "Interest",
          "val1": "1.65",
          "val2": "1.92",
          "chgp": "-14.06%",
          "chgp_class": "positive"
        },
        {
          "field": "Exceptional Items",
          "val1": "0.00",
          "val2": "0.00",
          "chgp": "",
          "chgp_class": "neutral"
        },
        {
          "field": "Consolidate Net Profit",
          "val1": "4.95",
          "val2": "5.44",
          "chgp": "-9.01%",
          "chgp_class": "negative"
        },
        {
          "field": "Operating Profit Margin (Excl OI)",
          "val1": "8.39%",
          "val2": "9.47%",
          "chgp": "-1.08%",
          "chgp_class": "negative"
        }
      ]
    }
  },
  {
    "link": "nine-monthly",
    "btn_text": "All Nine Monthly Results",
    "header": "Nine Monthly Results Snapshot (Consolidated) - Dec'25",
    "rhs": [
      {
        "prefix": "Net Sales ",
        "suffix": "YoY Growth in nine months ended Dec 2025 is 5.35% vs 8.95% in Dec 2024",
        "dir": -1
      },
      {
        "prefix": "Consolidated Net Profit ",
        "suffix": "YoY Growth in nine months ended Dec 2025 is -11.43% vs 9.34% in Dec 2024",
        "dir": -1
      }
    ],
    "table": {
      "header": [
        "Dec'25",
        "Dec'24",
        "Change(%)"
      ],
      "body": [
        {
          "field": "Net Sales",
          "val1": "203.26",
          "val2": "192.93",
          "chgp": "5.35%",
          "chgp_class": "positive"
        },
        {
          "field": "Operating Profit (PBDIT) excl Other Income",
          "val1": "17.64",
          "val2": "17.94",
          "chgp": "-1.67%",
          "chgp_class": "negative"
        },
        {
          "field": "Interest",
          "val1": "2.60",
          "val2": "2.86",
          "chgp": "-9.09%",
          "chgp_class": "positive"
        },
        {
          "field": "Exceptional Items",
          "val1": "0.00",
          "val2": "0.00",
          "chgp": "",
          "chgp_class": "neutral"
        },
        {
          "field": "Consolidate Net Profit",
          "val1": "7.05",
          "val2": "7.96",
          "chgp": "-11.43%",
          "chgp_class": "negative"
        },
        {
          "field": "Operating Profit Margin (Excl OI)",
          "val1": "8.68%",
          "val2": "9.30%",
          "chgp": "-0.62%",
          "chgp_class": "negative"
        }
      ]
    }
  },
  {
    "link": "annual",
    "btn_text": "All Annual Results",
    "header": "Annual Results Snapshot (Consolidated) - Mar'26",
    "rhs": [
      {
        "prefix": "Net Sales ",
        "suffix": "YoY Growth in year ended Mar 2026 is 2.49% vs 9.55% in Mar 2025",
        "dir": -1
      },
      {
        "prefix": "Consolidated Net Profit ",
        "suffix": "YoY Growth in year ended Mar 2026 is 16.28% vs 19.44% in Mar 2025",
        "dir": -1
      }
    ],
    "table": {
      "header": [
        "Mar'26",
        "Mar'25",
        "Change(%)"
      ],
      "body": [
        {
          "field": "Net Sales",
          "val1": "275.04",
          "val2": "268.35",
          "chgp": "2.49%",
          "chgp_class": "positive"
        },
        {
          "field": "Operating Profit (PBDIT) excl Other Income",
          "val1": "24.21",
          "val2": "22.70",
          "chgp": "6.65%",
          "chgp_class": "positive"
        },
        {
          "field": "Interest",
          "val1": "3.17",
          "val2": "3.63",
          "chgp": "-12.67%",
          "chgp_class": "positive"
        },
        {
          "field": "Exceptional Items",
          "val1": "0.00",
          "val2": "0.00",
          "chgp": "",
          "chgp_class": "neutral"
        },
        {
          "field": "Consolidate Net Profit",
          "val1": "11.43",
          "val2": "9.83",
          "chgp": "16.28%",
          "chgp_class": "positive"
        },
        {
          "field": "Operating Profit Margin (Excl OI)",
          "val1": "8.80%",
          "val2": "8.46%",
          "chgp": "0.34%",
          "chgp_class": "positive"
        }
      ]
    }
  }
]
Quarterly Results Snapshot (Consolidated) - Sep'26 - QoQstock-summary
Sep'26
Jun'26
Change(%)
Net Sales
79.68
72.20
10.36%
Operating Profit (PBDIT) excl Other Income
8.82
4.26
107.04%
Interest
0.61
0.59
3.39%
Exceptional Items
0.00
0.00
Consolidate Net Profit
4.88
2.26
115.93%
Operating Profit Margin (Excl OI)
11.07%
5.90%
5.17%
Values in Rs Cr.
Direction Arrows
Net Sales

QoQ Growth in quarter ended Sep 2026 is 10.36% vs 0.59% in Jun 2026

Direction Arrows
Consolidated Net Profit

QoQ Growth in quarter ended Sep 2026 is 115.93% vs -48.40% in Jun 2026

Half Yearly Results Snapshot (Consolidated) - Sep'25stock-summary
Sep'25
Sep'24
Change(%)
Net Sales
136.67
128.14
6.66%
Operating Profit (PBDIT) excl Other Income
11.46
12.14
-5.60%
Interest
1.65
1.92
-14.06%
Exceptional Items
0.00
0.00
Consolidate Net Profit
4.95
5.44
-9.01%
Operating Profit Margin (Excl OI)
8.39%
9.47%
-1.08%
Values in Rs Cr.
Direction Arrows
Net Sales

Growth in half year ended Sep 2025 is 6.66% vs 9.22% in Sep 2024

Direction Arrows
Consolidated Net Profit

Growth in half year ended Sep 2025 is -9.01% vs -0.55% in Sep 2024

Nine Monthly Results Snapshot (Consolidated) - Dec'25stock-summary
Dec'25
Dec'24
Change(%)
Net Sales
203.26
192.93
5.35%
Operating Profit (PBDIT) excl Other Income
17.64
17.94
-1.67%
Interest
2.60
2.86
-9.09%
Exceptional Items
0.00
0.00
Consolidate Net Profit
7.05
7.96
-11.43%
Operating Profit Margin (Excl OI)
8.68%
9.30%
-0.62%
Values in Rs Cr.
Direction Arrows
Net Sales

YoY Growth in nine months ended Dec 2025 is 5.35% vs 8.95% in Dec 2024

Direction Arrows
Consolidated Net Profit

YoY Growth in nine months ended Dec 2025 is -11.43% vs 9.34% in Dec 2024

Annual Results Snapshot (Consolidated) - Mar'26stock-summary
Mar'26
Mar'25
Change(%)
Net Sales
275.04
268.35
2.49%
Operating Profit (PBDIT) excl Other Income
24.21
22.70
6.65%
Interest
3.17
3.63
-12.67%
Exceptional Items
0.00
0.00
Consolidate Net Profit
11.43
9.83
16.28%
Operating Profit Margin (Excl OI)
8.80%
8.46%
0.34%
Values in Rs Cr.
Direction Arrows
Net Sales

YoY Growth in year ended Mar 2026 is 2.49% vs 9.55% in Mar 2025

Direction Arrows
Consolidated Net Profit

YoY Growth in year ended Mar 2026 is 16.28% vs 19.44% in Mar 2025

stock-summaryCompany CV
About Beardsell Ltd stock-summary
stock-summary
Beardsell Ltd
Micro Cap
Other Industrial Products
Incorporated in 1936, the Madras based Beardsell Ltd, are a diversified group engaged in the manufacture of different industrial products serving various customer segments. The Company presently has 7 manufacturing units across India and branches in all the major cities. There are multi-disciplinary teams consisting of experienced professional managers, project engineers, production technologists and R&D personnel at its various branches.
Company Coordinates stock-summary
Company Details
47 Greams Road , Chennai Tamil Nadu : 600006
stock-summary
Tel: 91-44-28293296/28290901
stock-summary
ho@beardsell.co.in
Registrar Details
Cameo Corporate Services Ltd , Subramanian Buildings No 1 , Club House Road, Chennai