
 Score
Dashboard
High Management Efficiency with a high ROE of 22.02%
Strong ability to service debt as the company has a low Debt to EBITDA ratio of 0.11 times
Poor long term growth as Net Sales has grown by an annual rate of -22.10% and Operating profit at -11.45% over the last 5 years
Positive results in Sep 26
Stock is technically in a Bearish range
With ROE of 14.5, it has a Expensive valuation with a 4.2 Price to Book Value
Increasing Participation by Institutional Investors
Mojo ParametersStock DNA

Garments & Apparels

INR 276 Cr (Micro Cap)

NA (Loss Making)
24

0.69%

-0.12

14.45%

4.24
Total ReturnsTotal Returns (Price + Dividend) 
Latest dividend: 0.04993757802746567 per share ex-dividend date: Sep-11-2026
Risk Adjusted Returns v/s
Returns Beta
 News & Corporate Actions
News
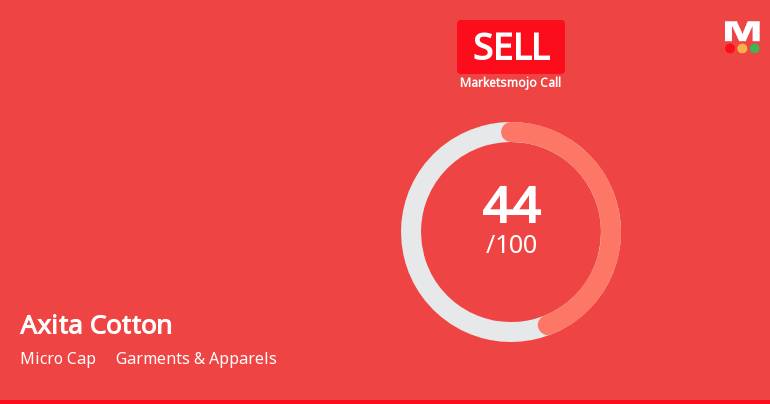
Axita Cotton Ltd Downgraded to Sell Amid Technical Weakness and Valuation Concerns
Axita Cotton Ltd, a micro-cap player in the Garments & Apparels sector, has seen its investment rating downgraded from Hold to Sell as of 09 Nov 2026. This revision reflects a combination of deteriorating technical indicators, expensive valuation metrics, subdued long-term financial trends, and cautious market sentiment despite recent quarterly earnings improvements.
Read More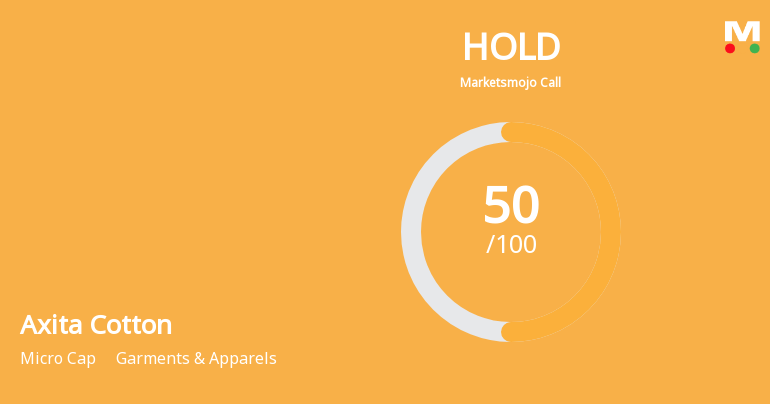
Axita Cotton Ltd is Rated Hold by MarketsMOJO
Axita Cotton Ltd is rated 'Hold' by MarketsMOJO, with this rating last updated on 02 November 2026. While the rating change occurred on that date, the analysis and financial metrics presented here reflect the stock's current position as of 04 November 2026, providing investors with the most up-to-date view of the company’s fundamentals and market performance.
Read More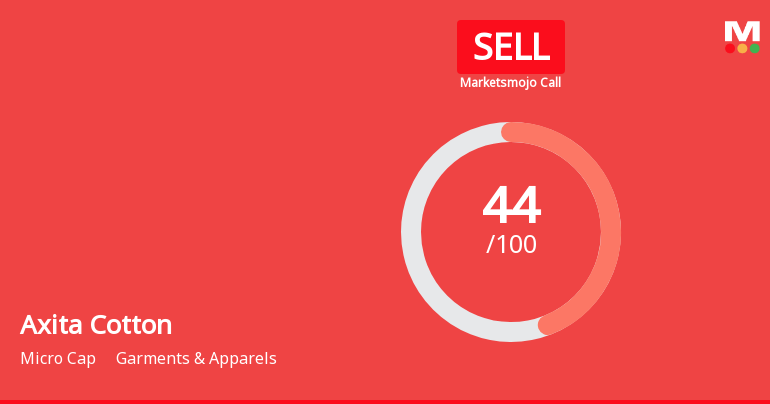
Axita Cotton Ltd Downgraded to Sell Amid Weak Technicals and Valuation Concerns
Axita Cotton Ltd, a micro-cap player in the Garments & Apparels sector, has seen its investment rating downgraded from Hold to Sell following a deterioration in its technical indicators and persistent challenges in long-term financial growth. Despite a recent quarter showing positive financial performance, the company’s overall outlook has weakened due to bearish technical trends, expensive valuation metrics, and subdued sales growth over the past five years.
Read More Announcements
Disclosures under Reg. 10(5) in respect of acquisition under Reg. 10(1)(a) of SEBI (SAST) Regulations 2011
09-Nov-2026 | Source : BSEThe Exchange has received the disclosure under Regulation 10(5) in respect of acquisition under Regulation 10(1)(a) of SEBI (Substantial Acquisition of Shares & Takeovers) Regulations 2011 for Gitaben Nitinbhai Patel
Disclosures under Reg. 10(5) in respect of acquisition under Reg. 10(1)(a) of SEBI (SAST) Regulations 2011
07-Nov-2026 | Source : BSEThe Exchange has received the disclosure under Regulation 10(5) in respect of acquisition under Regulation 10(1)(a) of SEBI (Substantial Acquisition of Shares & Takeovers) Regulations 2011 for Mrs. Gitaben Nitinbhai Patel
Submission Of Disclosure Under Regulation 10(5) Of SEBI (Substantial Acquisition Of Shares And Takeovers) Regulations 2011
06-Nov-2026 | Source : BSESubmission of disclosure under regulation 10(5) of SEBI (SAST) Regulations 2011.
Corporate Actions

No Upcoming Board Meetings

Axita Cotton Ltd has declared 5% dividend, ex-date: 11 Sep 26

Axita Cotton Ltd has announced 1:10 stock split, ex-date: 21 Oct 22

Axita Cotton Ltd has announced 1:10 bonus issue, ex-date: 13 Feb 26

No Rights history available
Key FactorsQuality key factors
Valuation key factors
Technicals key factors
 Technical Indicator Scale: Bearish, Mildly Bearish, Sideways, Mildly Bullish, Bullish Turned Shareholding
Shareholding Snapshot : Sep 2026
Shareholding Compare (%holding)
Non Institution
None
Held by 0 Schemes
Held by 9 FIIs (6.64%)
Nitinbhai Govindbhai Patel (26.49%)
M7 Global Fund Pcc - Nolana (3.28%)
45.64%
FinancialQuarterly Results Snapshot (Standalone) - Sep'26 - QoQ
 Compare with Peers

QoQ Growth in quarter ended Sep 2026 is 16.27% vs -4.51% in Jun 2026

QoQ Growth in quarter ended Sep 2026 is 54.04% vs 253.42% in Jun 2026

Half Yearly Results Snapshot (Standalone) - Sep'25
Growth in half year ended Sep 2025 is -22.77% vs -53.81% in Sep 2024
Growth in half year ended Sep 2025 is -60.43% vs -65.96% in Sep 2024
Nine Monthly Results Snapshot (Standalone) - Dec'25
YoY Growth in nine months ended Dec 2025 is -39.68% vs -41.85% in Dec 2024
YoY Growth in nine months ended Dec 2025 is 44.07% vs -80.82% in Dec 2024
Annual Results Snapshot (Standalone) - Mar'26
YoY Growth in year ended Mar 2026 is -43.25% vs -40.80% in Mar 2025
YoY Growth in year ended Mar 2026 is 74.31% vs -94.64% in Mar 2025
 Company CV
About Axita Cotton Ltd

Company Coordinates


