
 Score
Dashboard
Company has a low Debt to Equity ratio (avg) at 0.23 times
Healthy long term growth as Net Sales has grown by an annual rate of 287.90% and Operating profit at 55.70%
With a growth in Net Profit of 46.9%, the company declared Very Positive results in Sep 26
Stock is technically in a Bearish range
With ROCE of 4.8, it has a Very Attractive valuation with a 0.8 Enterprise value to Capital Employed
Majority shareholders : Non Institution
Mojo ParametersStock DNA

Trading & Distributors

INR 258 Cr (Micro Cap)

9.00
19

0.00%

0.15

4.12%

0.72
Total ReturnsTotal Returns (Price + Dividend) 
Astal Lab for the last several years.
Risk Adjusted Returns v/s
Returns Beta
 News & Corporate Actions
News
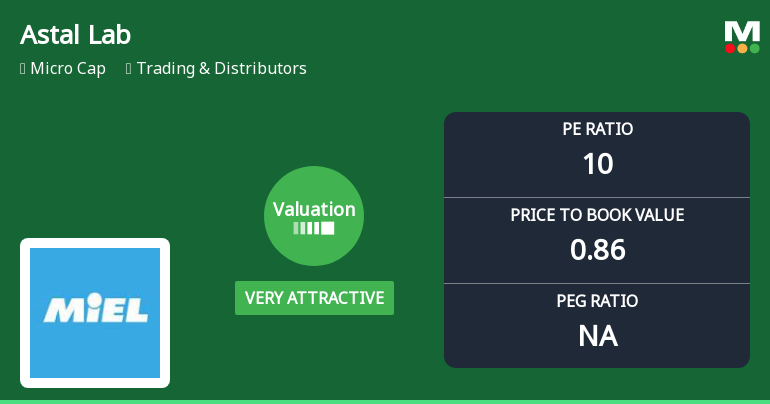
Astal Laboratories Ltd Valuation Shifts to Very Attractive Amid Mixed Returns
Astal Laboratories Ltd has witnessed a significant shift in its valuation parameters, moving from an attractive to a very attractive price level, driven primarily by a notable decline in its price-to-earnings (P/E) and price-to-book value (P/BV) ratios. This recalibration of valuation metrics invites a closer examination of the company’s price attractiveness relative to its historical averages and peer group within the Trading & Distributors sector.
Read More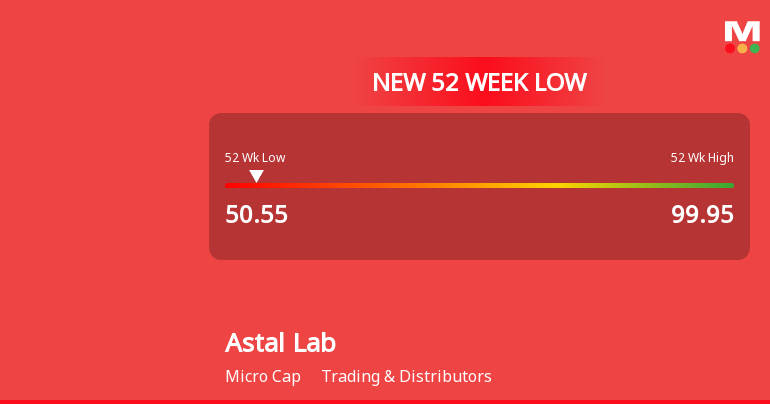
Astal Laboratories Ltd Falls to 52-Week Low of Rs 50.55 as Sell-Off Deepens
A 45.18% decline over the past year has culminated in Astal Laboratories Ltd hitting a fresh 52-week low of Rs 50.55 on 3 Nov 2026, despite the broader market rallying with the Sensex up 1.26% on the same day.
Read More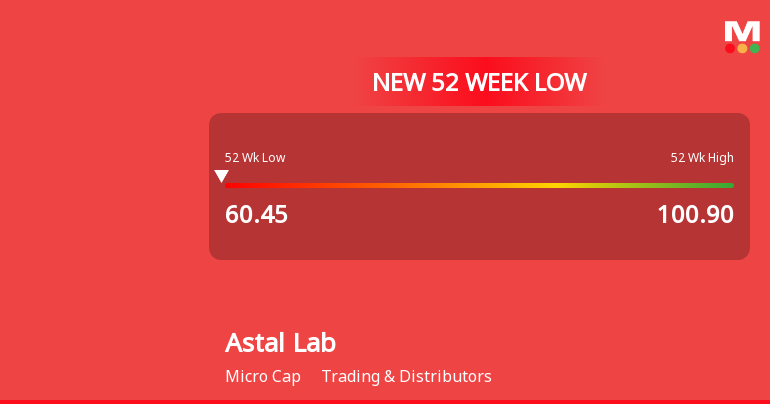
Five Consecutive Losses Push Astal Laboratories Ltd to a New 52-Week Low
For the fifth straight session, Astal Laboratories Ltd closed lower, breaching its 52-week low territory at Rs 60.45 on 30 Oct 2026. This persistent decline has dragged the stock down by 8.72% over the last three days alone, underperforming its sector which gained 2.24% on the same day.
Read More Announcements
Announcement under Regulation 30 (LODR)-Newspaper Publication
17-Nov-2026 | Source : BSESubmission of newspaper publication of Quarterly results.
Results- Financial Results For September 30 2026.
13-Nov-2026 | Source : BSESubmission of Financial Results.
Compliances- Statement Of Deviation & Variation
13-Nov-2026 | Source : BSESubmission of statement of Deviation and variation for September 2026 quarter.
Corporate Actions

No Upcoming Board Meetings

No Dividend history available

No Splits history available

No Bonus history available

No Rights history available
Key FactorsQuality key factors
Valuation key factors
Technicals key factors
 Technical Indicator Scale: Bearish, Mildly Bearish, Sideways, Mildly Bullish, Bullish Turned Shareholding
Shareholding Snapshot : Sep 2026
Shareholding Compare (%holding)
Non Institution
None
Held by 0 Schemes
Held by 0 FIIs
Aceso Research Labs Llp (4.59%)
Sesha Sai Nikhil Chintalapati (11.38%)
81.03%
FinancialQuarterly Results Snapshot (Standalone) - Sep'26 - YoY
 Compare with Peers

YoY Growth in quarter ended Sep 2026 is 8.53% vs 185.11% in Sep 2025

YoY Growth in quarter ended Sep 2026 is 46.90% vs 29.00% in Sep 2025

Half Yearly Results Snapshot (Standalone) - Sep'25
Growth in half year ended Sep 2025 is 138.84% vs 782.89% in Sep 2024
Growth in half year ended Sep 2025 is 26.56% vs 9,125.00% in Sep 2024
Nine Monthly Results Snapshot (Standalone) - Dec'25
YoY Growth in nine months ended Dec 2025 is 182.27% vs 257.95% in Dec 2024
YoY Growth in nine months ended Dec 2025 is 13.75% vs 1,066.04% in Dec 2024
Annual Results Snapshot (Standalone) - Mar'26
YoY Growth in year ended Mar 2026 is 142.88% vs 171.59% in Mar 2025
YoY Growth in year ended Mar 2026 is -9.07% vs 1,044.87% in Mar 2025
 Company CV
About Astal Laboratories Ltd

Company Coordinates


