
 Score
Dashboard
Weak Long Term Fundamental Strength with an average Return on Equity (ROE) of 4.22%
- Poor long term growth as Net Sales has grown by an annual rate of -7.46% and Operating profit at -16.66% over the last 5 years
Negative results in Sep 26
With ROE of 2.2, it has a Expensive valuation with a 0.6 Price to Book Value
Despite the size of the company, domestic mutual funds hold only 0% of the company
Consistent Underperformance against the benchmark over the last 3 years
Mojo ParametersStock DNA

Gems, Jewellery And Watches

INR 1,008 Cr (Micro Cap)

27.00
52

0.24%

0.05

2.16%

0.60
Total ReturnsTotal Returns (Price + Dividend) 
Latest dividend: 1.5000000000000002 per share ex-dividend date: Sep-21-2026
Risk Adjusted Returns v/s
Returns Beta
 News & Corporate Actions
News
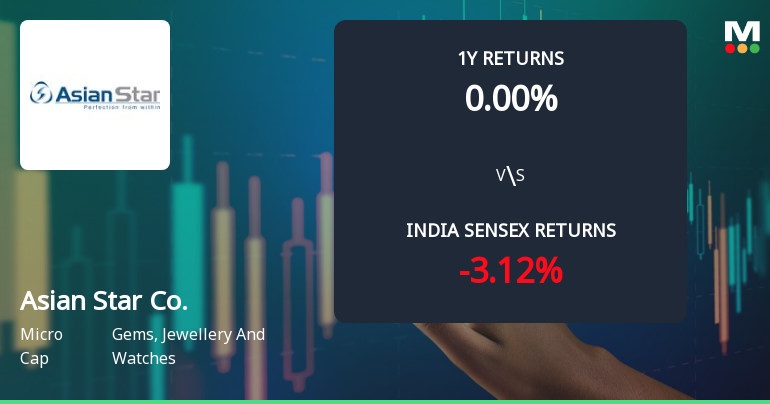
Asian Star Company Ltd Technical Momentum Shifts Amid Mixed Market Signals
Asian Star Company Ltd, a micro-cap player in the Gems, Jewellery and Watches sector, has experienced a nuanced shift in its technical momentum, moving from a bullish to a mildly bullish stance. Despite a recent decline in price, the stock’s technical indicators present a complex picture, with some metrics signalling strength while others remain neutral or mildly bearish. This analysis delves into the latest technical parameters, price momentum, and comparative market performance to provide a comprehensive view for investors.
Read More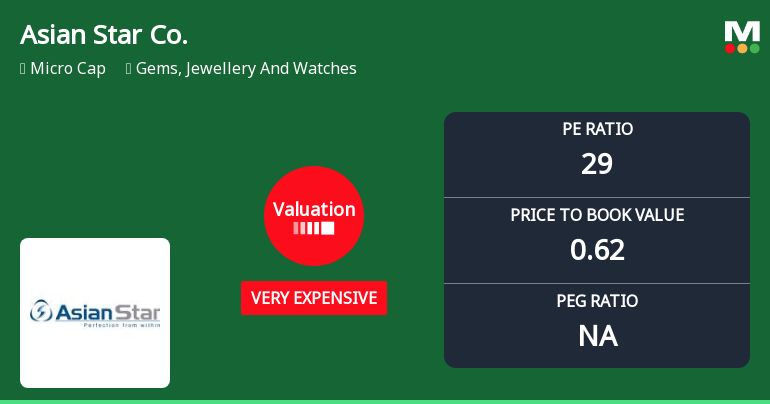
Asian Star Company Ltd Valuation Shifts to Very Expensive Amid Mixed Market Returns
Asian Star Company Ltd, a micro-cap player in the Gems, Jewellery and Watches sector, has seen its valuation parameters shift markedly, moving from an expensive to a very expensive rating. This change reflects a significant reappraisal of its price-to-earnings (P/E) and price-to-book value (P/BV) ratios relative to historical levels and peer benchmarks, raising questions about its price attractiveness in a competitive market environment.
Read More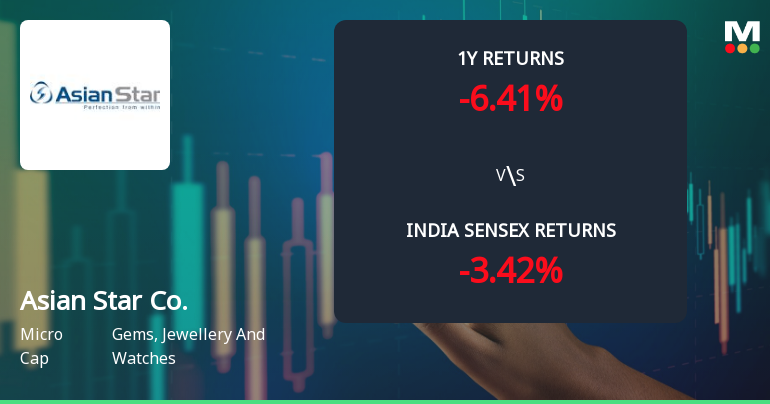
Asian Star Company Ltd Technical Momentum Shifts Amid Mixed Indicator Signals
Asian Star Company Ltd, a micro-cap player in the Gems, Jewellery and Watches sector, has experienced a notable shift in its technical momentum, reflecting a complex interplay of bullish and bearish signals. Despite a recent downgrade in its Mojo Grade to 'Sell' from 'Strong Sell', the stock's technical indicators reveal a nuanced picture that investors should carefully analyse amid volatile market conditions.
Read More Announcements
Announcement under Regulation 30 (LODR)-Newspaper Publication
05-Nov-2026 | Source : BSENewspaper advertisement pertaining to financials results for the quarter and half year ended as on September 30 2026
Disclosure Under Regulation 30 Of SEBI (Listing Obligations And Disclosure Requirements) Regulations 2015
04-Nov-2026 | Source : BSEDisclosure under regulation 30 of SEBI (LODR) Reg. 2015 - Receipt of Penalty order under Section 271G of the Income Tax Act 1961.
Board Meeting Outcome for Outcome Of Board Meeting Of The Company Held On Wednesday November 04 2026
04-Nov-2026 | Source : BSE1. Approved the Un-Audited Financial Statements (Standalone & Consolidated) along with Limited Review Report (Standalone & Consolidated) of the Company for the quarter and half year ended September 30 2026 prepared in accordance with Ind AS
Corporate Actions

No Upcoming Board Meetings

Asian Star Company Ltd has declared 15% dividend, ex-date: 21 Sep 26

No Splits history available

Asian Star Company Ltd has announced 1:2 bonus issue, ex-date: 19 Jul 12

No Rights history available
Key FactorsQuality key factors
Valuation key factors
Technicals key factors
 Technical Indicator Scale: Bearish, Mildly Bearish, Sideways, Mildly Bullish, Bullish Turned Shareholding
Shareholding Snapshot : Sep 2026
Shareholding Compare (%holding)
Promoters
None
Held by 0 Schemes
Held by 0 FIIs
Vipul Prabodh Shah (24.99%)
Flora Impex Private Limited (4.9%)
0.31%
FinancialQuarterly Results Snapshot (Consolidated) - Sep'26 - YoY
 Compare with Peers

YoY Growth in quarter ended Sep 2026 is -20.45% vs 16.12% in Sep 2025

YoY Growth in quarter ended Sep 2026 is 29.40% vs -31.86% in Sep 2025

Half Yearly Results Snapshot (Consolidated) - Sep'25
Growth in half year ended Sep 2025 is 4.44% vs -23.45% in Sep 2024
Growth in half year ended Sep 2025 is -12.91% vs -12.09% in Sep 2024
Nine Monthly Results Snapshot (Consolidated) - Dec'25
YoY Growth in nine months ended Dec 2025 is 1.65% vs -17.17% in Dec 2024
YoY Growth in nine months ended Dec 2025 is -14.37% vs -18.61% in Dec 2024
Annual Results Snapshot (Consolidated) - Mar'26
YoY Growth in year ended Mar 2026 is -2.49% vs -16.11% in Mar 2025
YoY Growth in year ended Mar 2026 is -6.41% vs -44.08% in Mar 2025
 Company CV
About Asian Star Company Ltd

Company Coordinates


