
 Mojo Parameters
Stock DNA

Industrial Manufacturing

INR 498 Cr (Micro Cap)

NA (Loss Making)
39

0.00%

54.00

-726.00%

513.19
Total ReturnsTotal Returns (Price + Dividend) 
Artson for the last several years.
Risk Adjusted Returns v/s
Returns Beta
 News & Corporate Actions
News
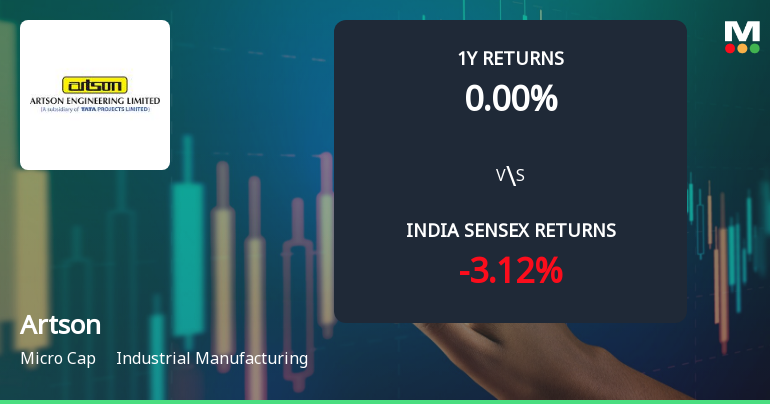
Artson Ltd Faces Intensified Downtrend Amid Technical Momentum Shift
Artson Ltd, a micro-cap player in the Industrial Manufacturing sector, has experienced a notable shift in its technical momentum, signalling increased bearishness. The company’s share price has declined sharply, reflecting deteriorating technical indicators and a downgrade in its MarketsMOJO Mojo Grade to Strong Sell as of 12 Oct 2026.
Read More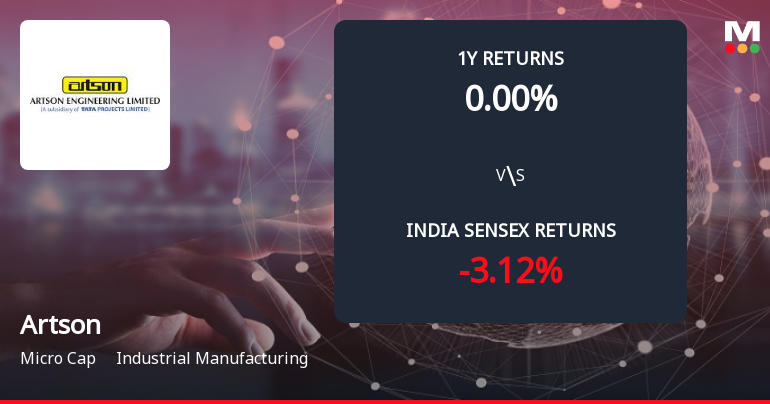
Artson Ltd Forms Death Cross, Signalling Potential Bearish Trend
Artson Ltd, a micro-cap player in the Industrial Manufacturing sector, has recently formed a Death Cross, a significant technical indicator where the 50-day moving average crosses below the 200-day moving average. This development signals a potential shift towards a bearish trend, reflecting deteriorating momentum and raising concerns about the stock’s medium to long-term outlook.
Read More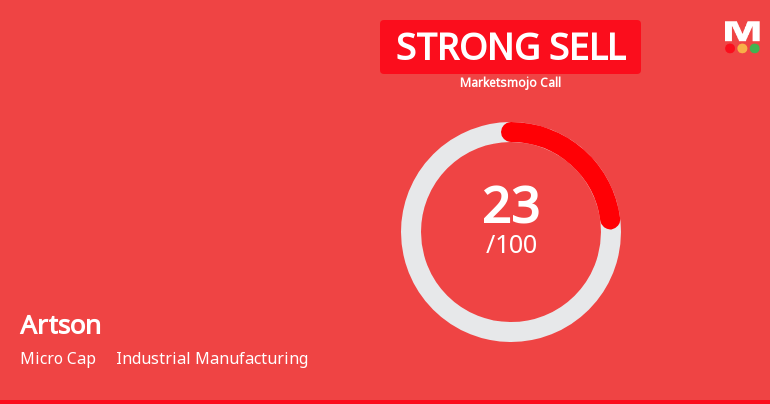
Artson Ltd is Rated Strong Sell
Artson Ltd is rated Strong Sell by MarketsMOJO. This rating was last updated on 12 October 2026, reflecting a reassessment of the company’s outlook. However, all fundamentals, returns, and financial metrics discussed here are current as of 16 November 2026, providing investors with the latest view of the stock’s position.
Read More Announcements
Announcement under Regulation 30 (LODR) - Bagging/receiving of order(s) or contract(s)
10-Nov-2026 | Source : BSEReceipt of Award. Details enclosed.
Announcement under Regulation 30 (LODR)-Cessation
10-Nov-2026 | Source : BSEResignation of Mr. Shashank Jha from the position of CEO and Whole-Time Director. Details enclosed.
Resignation Of CEO And Whole-Time Director
10-Nov-2026 | Source : BSEResignation of CEO and Whole-Time Director. Details Enclosed
Corporate Actions

No Upcoming Board Meetings

No Dividend history available

Artson Ltd has announced 1:10 stock split, ex-date: 01 Feb 08

No Bonus history available

No Rights history available
Key FactorsQuality key factors
Valuation key factors
Technicals key factors
 Technical Indicator Scale: Bearish, Mildly Bearish, Sideways, Mildly Bullish, Bullish Turned Shareholding
Shareholding Snapshot : Sep 2026
Shareholding Compare (%holding)
Promoters
None
Held by 2 Schemes (0.01%)
Held by 3 FIIs (0.0%)
Tata Projects Limited (75.0%)
Consortium Securities Private Limited (1.14%)
19.8%
FinancialQuarterly Results Snapshot (Standalone) - Sep'26 - QoQ
 Compare with Peers

QoQ Growth in quarter ended Sep 2026 is 48.03% vs -32.57% in Jun 2026
QoQ Growth in quarter ended Sep 2026 is 590.24% vs -112.20% in Jun 2026

Half Yearly Results Snapshot (Standalone) - Sep'25
Growth in half year ended Sep 2025 is 108.74% vs -38.22% in Sep 2024
Growth in half year ended Sep 2025 is 42.29% vs -182.55% in Sep 2024
Nine Monthly Results Snapshot (Standalone) - Dec'25
YoY Growth in nine months ended Dec 2025 is 100.37% vs -39.66% in Dec 2024

YoY Growth in nine months ended Dec 2025 is -594.44% vs -39.11% in Dec 2024
Annual Results Snapshot (Standalone) - Mar'26
YoY Growth in year ended Mar 2026 is 44.06% vs -11.37% in Mar 2025
YoY Growth in year ended Mar 2026 is -412.64% vs -42.48% in Mar 2025
 Company CV
About Artson Ltd

Company Coordinates


