
 Score
Dashboard
With a Operating Losses, the company has a Weak Long Term Fundamental Strength
- Company's ability to service its debt is weak with a poor EBIT to Interest (avg) ratio of 0.77
- The company has been able to generate a Return on Equity (avg) of 4.34% signifying low profitability per unit of shareholders funds
- PAT(Q) At Rs -1.19 cr has Fallen at -440.0% (vs previous 4Q average)
- PBDIT(Q) Lowest at Rs -1.37 cr.
- OPERATING PROFIT TO NET SALES (Q) Lowest at -3.82%
Stock is technically in a Bearish range
Risky - Negative Operating Profits
Below par performance in long term as well as near term
Mojo ParametersStock DNA

Industrial Products

INR 25 Cr (Micro Cap)

NA (Loss Making)
9

0.00%

0.27

-0.13%

0.65
Total ReturnsTotal Returns (Price + Dividend) 
Latest dividend: 1.0000 per share ex-dividend date: Sep-18-2006
Risk Adjusted Returns v/s
Returns Beta
 News & Corporate Actions
News
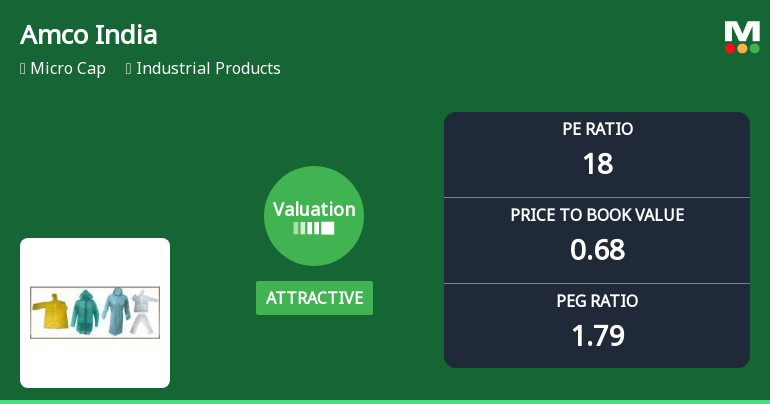
Amco India Ltd Valuation Turns Attractive Amid Market Pressure
Amco India Ltd, a micro-cap player in the industrial products sector, has witnessed a notable shift in its valuation parameters, moving from fair to attractive territory. Despite a recent sharp decline in share price, the company’s price-to-earnings (P/E) and price-to-book value (P/BV) ratios now present a compelling case for value investors seeking opportunities in the small-cap space.
Read More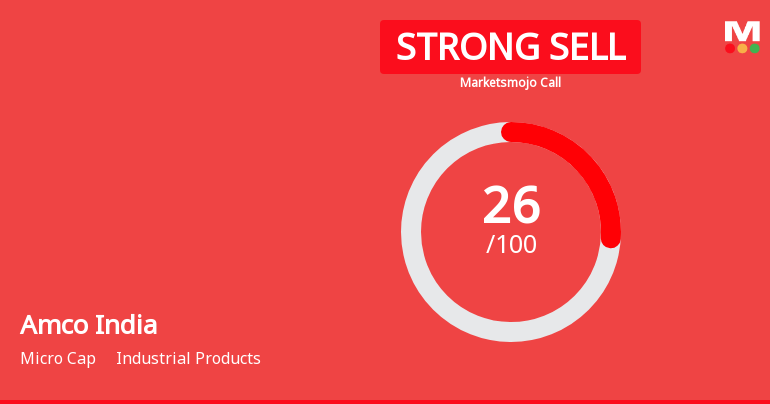
Amco India Ltd Downgraded to Strong Sell Amid Weak Fundamentals and Bearish Technicals
Amco India Ltd, a micro-cap player in the Industrial Products sector, has seen its investment rating downgraded from Sell to Strong Sell as of 21 Oct 2026. This revision reflects deteriorating technical indicators, weak long-term financial trends, and subdued quality metrics despite some recent positive quarterly results. The stock’s underperformance relative to the broader market and peers has further weighed on investor sentiment.
Read More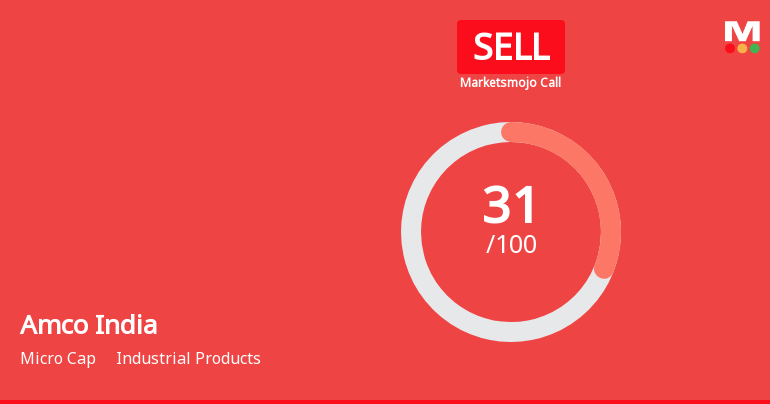
Amco India Ltd Upgraded to Sell on Technical Improvements Despite Weak Fundamentals
Amco India Ltd, a micro-cap player in the industrial products sector, has seen its investment rating upgraded from Strong Sell to Sell as of 13 Oct 2026. This change reflects a nuanced shift in the company’s technical outlook, despite ongoing challenges in its fundamental and financial metrics. The upgrade is primarily driven by improved technical indicators, while valuation and financial trends continue to present a mixed picture for investors.
Read More Announcements
Announcement under Regulation 30 (LODR)-Newspaper Publication
30-Oct-2026 | Source : BSEAttached herewith the copies of newspaper advertisement of unaudited financial results of the Company as approved in the Board meeting held on 27th October 2026.
Shareholder Meeting / Postal Ballot-Outcome of AGM
29-Oct-2026 | Source : BSEAttached herewith the copy of minutes of 39th Annual General Meeting of the Company.
Board Meeting Outcome for Approved Unaudited Financial Results For The Quarter & Half Year Ended On 30Th September 2026.
27-Oct-2026 | Source : BSEAttached herewith the copy of approved unaudited Financial Results for the quarter & half year ended on 30th September 2026 alongwith the Limited Review Report.
Corporate Actions

No Upcoming Board Meetings

Amco India Ltd has declared 10% dividend, ex-date: 18 Sep 06

No Splits history available

No Bonus history available

No Rights history available
Key FactorsQuality key factors
Valuation key factors
Technicals key factors
 Technical Indicator Scale: Bearish, Mildly Bearish, Sideways, Mildly Bullish, Bullish Turned Shareholding
Shareholding Snapshot : Sep 2026
Shareholding Compare (%holding)
Promoters
None
Held by 1 Schemes (0.0%)
Held by 0 FIIs
Late Surender Kumar Gupta (17.94%)
Raju Bhandari (5.38%)
30.05%
FinancialQuarterly Results Snapshot (Standalone) - Sep'26 - QoQ
 Compare with Peers

QoQ Growth in quarter ended Sep 2026 is 11.59% vs 10.55% in Jun 2026

QoQ Growth in quarter ended Sep 2026 is -226.60% vs 1,780.00% in Jun 2026

Half Yearly Results Snapshot (Standalone) - Sep'25
Growth in half year ended Sep 2025 is 15.04% vs -5.24% in Sep 2024
Growth in half year ended Sep 2025 is -85.06% vs 50.00% in Sep 2024
Nine Monthly Results Snapshot (Standalone) - Dec'25
YoY Growth in nine months ended Dec 2025 is 9.72% vs -3.37% in Dec 2024
YoY Growth in nine months ended Dec 2025 is -81.70% vs 163.79% in Dec 2024
Annual Results Snapshot (Standalone) - Mar'26
YoY Growth in year ended Mar 2026 is 11.81% vs 1.65% in Mar 2025
YoY Growth in year ended Mar 2026 is -82.35% vs 125.30% in Mar 2025
 Company CV
About Amco India Ltd

Company Coordinates


