
 Score
Dashboard
With a Negative Book Value, the company has a Weak Long Term Fundamental Strength
- Poor long term growth as Net Sales has grown by an annual rate of -8.92% and Operating profit at -231.27% over the last 5 years
- High Debt Company with a Debt to Equity ratio (avg) at 3.40 times
- The company has been able to generate a Return on Equity (avg) of 2.35% signifying low profitability per unit of shareholders funds
Negative results in Sep 26
Stock is technically in a Mildly Bearish range
Risky - Negative EBITDA
100% of Promoter Shares are Pledged
Mojo ParametersStock DNA

Iron & Steel Products

INR 5 Cr (Micro Cap)

NA (Loss Making)
21

0.00%

-3.71

264.95%

-1.84
Total ReturnsTotal Returns (Price + Dividend) 
Aditya Ispat for the last several years.
Risk Adjusted Returns v/s
Returns Beta
 News & Corporate Actions
News
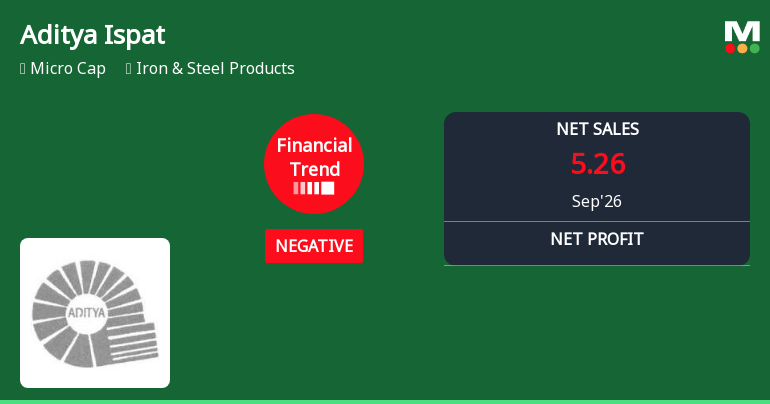
Aditya Ispat Ltd. Reports Negative Financial Trend Amidst Mixed Market Returns
Aditya Ispat Ltd., a micro-cap player in the Iron & Steel Products sector, has reported a marked deterioration in its financial performance for the quarter ended September 2026. The company’s financial trend has shifted from flat to negative, reflecting significant challenges in revenue generation and operating cash flows, which have weighed heavily on investor sentiment and its market valuation.
Read More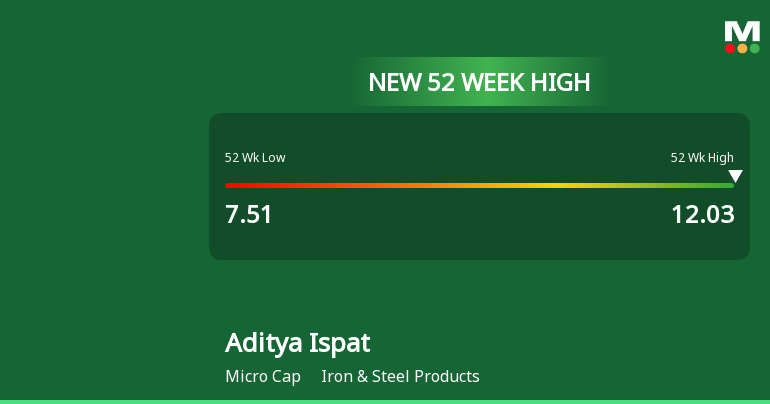
Broad-Based Technical Strength Lifts Aditya Ispat Ltd. to 52-Week High of Rs 12.03
Surging to a fresh 52-week high of Rs 12.03 on 12 Nov 2026, Aditya Ispat Ltd. has demonstrated robust price momentum, outpacing its sector and marking a significant milestone in its year-long rally from Rs 7.51. This technical breakout is underpinned by a confluence of bullish signals across multiple timeframes, signalling strong momentum in the iron and steel products space.
Read More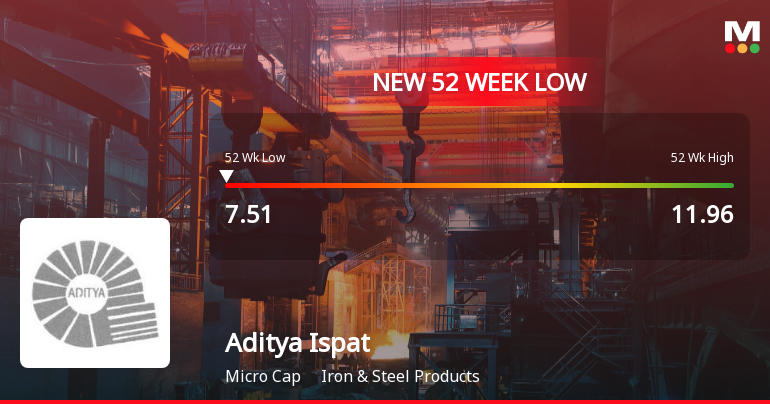
Aditya Ispat Ltd. Falls to 52-Week Low of Rs 7.51 as Sell-Off Deepens
For the third consecutive session, Aditya Ispat Ltd. has seen its share price decline sharply, culminating in a fresh 52-week low of Rs 7.51 on 1 Oct 2026. This marks a 16.46% drop over the last three days, underscoring persistent selling pressure amid a challenging market backdrop.
Read More Announcements
Announcement under Regulation 30 (LODR)-Newspaper Publication
17-Nov-2026 | Source : BSENewspaper Publication of Unaudited Financial Results for the Quarter and Half Year Ended published in both English and Telugu Newspapers dated 17-11-2026
Non Applicability Of Regulation 23(9) Of SEBI (Listing Obligation And Disclosure Requirements) Regulations 2015 Regarding Disclosure On Related Party Transactions For The Half Year Ended September 30 2026
14-Nov-2026 | Source : BSENon Applicability of Regulation 23 (9) of SEBI (LODR) Regulations 2015 regarding disclosure on Related Party Transactions for the Half Year Ended September 302026
Results Financial Results For Quarter And Half Year Ended September 302026 (Unaudited)
14-Nov-2026 | Source : BSEResults - Financial Results for Quarter and Half Year Ended September 302026 (Unaudited)
Corporate Actions

No Upcoming Board Meetings

No Dividend history available

No Splits history available

No Bonus history available

No Rights history available
Key FactorsQuality key factors
Valuation key factors
Technicals key factors
 Technical Indicator Scale: Bearish, Mildly Bearish, Sideways, Mildly Bullish, Bullish Turned Shareholding
Shareholding Snapshot : Sep 2026
Shareholding Compare (%holding)
Non Institution
100
Held by 0 Schemes
Held by 0 FIIs
Usha Chachan (8.9%)
S D Chachan Commercial Private Limited (8.53%)
58.28%
FinancialQuarterly Results Snapshot (Standalone) - Sep'26 - YoY
 Compare with Peers

YoY Growth in quarter ended Sep 2026 is -39.47% vs -35.15% in Sep 2025

YoY Growth in quarter ended Sep 2026 is -37.11% vs -79.63% in Sep 2025

Half Yearly Results Snapshot (Standalone) - Sep'25
Growth in half year ended Sep 2025 is -36.82% vs -23.04% in Sep 2024
Growth in half year ended Sep 2025 is -78.50% vs -5,450.00% in Sep 2024
Nine Monthly Results Snapshot (Standalone) - Dec'25
YoY Growth in nine months ended Dec 2025 is -34.54% vs -17.16% in Dec 2024
YoY Growth in nine months ended Dec 2025 is -1,019.05% vs -1,150.00% in Dec 2024
Annual Results Snapshot (Standalone) - Mar'26
YoY Growth in year ended Mar 2026 is -25.38% vs -29.16% in Mar 2025
YoY Growth in year ended Mar 2026 is -1,000.00% vs 66.23% in Mar 2025
 Company CV
About Aditya Ispat Ltd.

Company Coordinates


